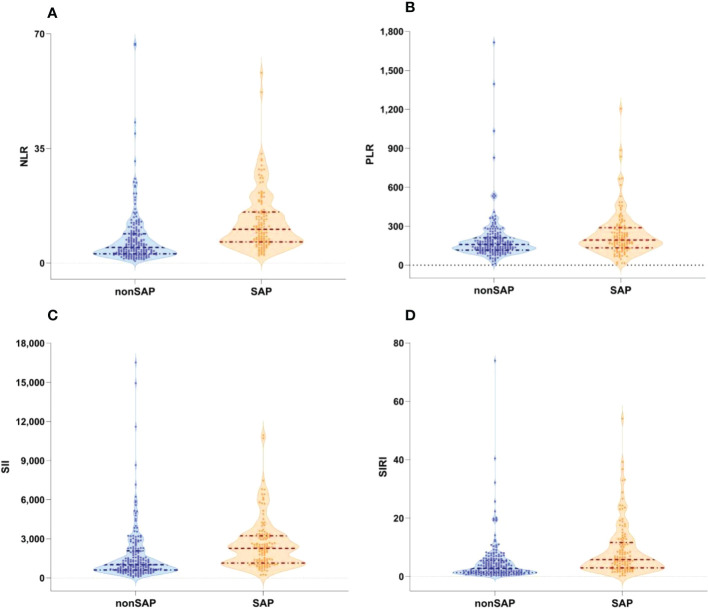
Figure 1.
Boxplots of the NLR, PLR SII and SIRI showing the distribution in the non-SAP group (n=194) and SAP group (n=126). (A) The NLR of the SAP group was higher than that of the non-SAP group (<0.001). (B) The PLR of the SAP group was higher than that of the non-SAP group. (p=0.001). (C) The SII of the SAP group was higher than that of the non-SAP group. (<0.001). (D) The SIRI of the SAP group was higher than that of the non-SAP group(<0.001). NLR, neutrophil-to-lymphocyte ratio; SII, systemic immune-inflammation index; PLR, platelet-to-lymphocyte ratio; SIRI, systemic inflammation response index; SAP, stroke-associated pneumonia; non-SAP, non-stroke-associated pneumonia.

