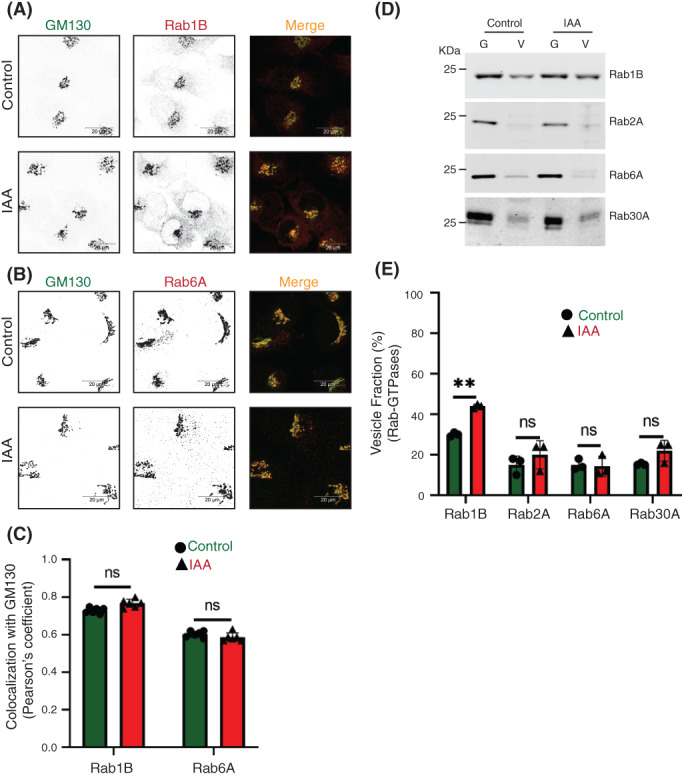
FIGURE 5.

The majority of conserved oligomeric Golgi (COG)‐interacting Golgi Rabs are not changing their localization upon COG4 depletion. Airyscan superresolution IF analysis of untreated (control) or IAA treated COG4‐mAID cells stained for (A) GM130 (green) and Rab1B (red), and (B) GM130 (green) and Rab6 (red). Scale bars, 20 μm. For better presentation, green and red channels are shown in inverted black and white mode whereas the merged view is shown in RGB mode. (C) Colocalization of Rab‐GTPases with GM130 was performed by calculating Pearson's correlation coefficient, >90 cells were analyzed. Statistical significance was calculated by GraphPad Prism 8 using paired t‐test. Here, p ≥ 0.05, nonsignificant (ns). Error bar represents mean ± SD. (D) WB analysis of Rab1B, Rab2A, Rab6A, and Rab30A in Golgi and vesicle fractions. Equal volumes of Golgi (G) and vesicle (V) membrane fractions were analyzed with antibodies as indicated. (E) The graph represents the quantification of vesicle fraction (%) of Rab‐GTPases in COG depleted cells compared to control. Rab‐GTPase abundance in vesicles was calculated as a percentage of the immuno signal in the vesicle fraction to the combined signal in Golgi and vesicle fractions from n = 3 independent experiments. Statistical significance was calculated by GraphPad Prism 8 using paired t‐test. Here, p ≥ 0.05, nonsignificant and **p ≤ 0.01. Error bar represents mean ± SD
