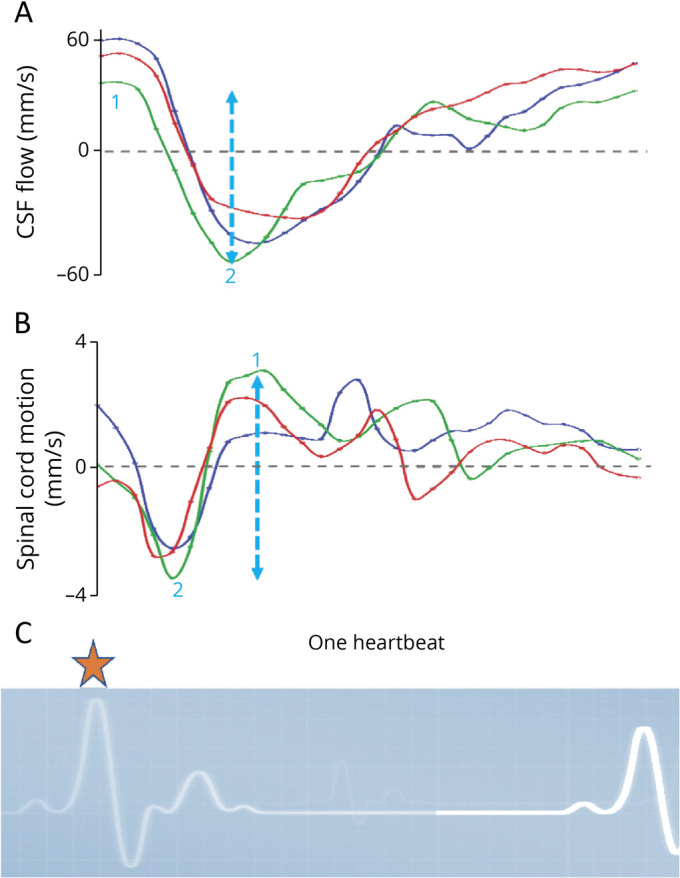
Figure 2. Interpretation of Time-Resolved Velocity Data Curves.

Curves of 3 exemplary velocity measurements (y-axis) of CSF flow (A) and spinal cord motion (B) at C2/C3 over 1 standardized heartbeat (x-axis). The beginning of measurements is triggered by R-peaks of the ECG (C, orange star). Thus, the displayed curves start shortly after the beginning of the cardiac systolic phase and shortly before the arrival of the maximum pulse wave at the cranium. While CSF continues to flow in caudal direction shortly after the R-peak of the ECG (negative values), the spinal cord motion is redirected towards the cranium (positive values). Two main parameters are analyzed per each individual curve: The peak-to-peak amplitude (mm/s, blue dotted arrow marking the green velocity curve) is calculated by maximum velocity in the cranial direction (1 = positive value) minus maximum velocity in the caudal direction (2 = negative value). It gives information on the maximum extent of craniocaudal CSF flow and spinal cord motion, respectively. The individual's duration of the heartbeat in milliseconds is used to derive the entire area under the curve (mm), which is added irrespective of the positive or negative values. The value is called total displacement (mm) and gives information of the absolute distance the chosen Region of interest of CSF and spinal cord tissue is moved in cranial and caudal direction over a heartbeat, respectively. It comprises information of the entire curve within a value.
