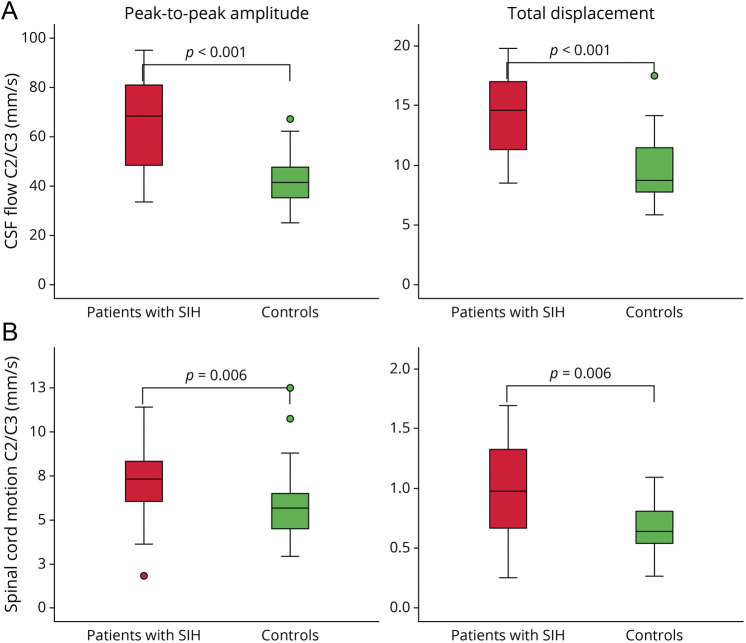
Figure 3. Boxplots of CSF Flow (A) and Spinal Cord Motion (B) in Patients With SIH (Red) Compared With Healthy Controls (Green) at Segment C2/C3.
The extent of the craniocaudal peaks of the velocity curves (peak-to-peak amplitude—left) and the absolute distance of CSF flow and spinal cord motion over 1 heartbeat (total displacement—right) are significantly higher in patients with SIH. SIH = spontaneous intracranial hypotension

