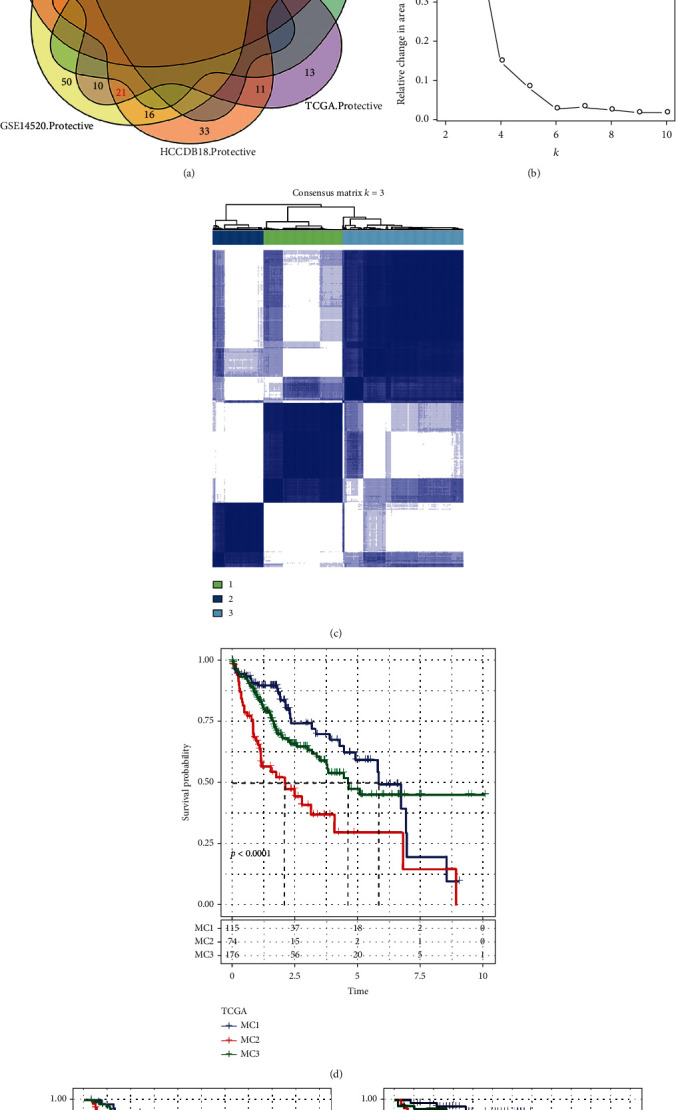
Figure 1.

The metabolism cluster in HCC. (a) Intersection Venn diagram showing metabolic genes with substantial prognostic significance in the 3 cohorts. (b) CDF curve of cohort samples from the TCGA and CDF delta area curve, consensus clustering's delta area curve, reflecting the degree of variance in the area under the cumulative distribution function (CDF) curve for each classification number k in comparison to k–1. The category number k is represented on the horizontal axis, and the relative change of the area under the CDF curve is shown on the vertical axis. (c) Heat diagram of a sample clustering when consensus k = 3. (d–f) KM curve of the prognostic relationship of the three subtypes in the TCGA (d), GSE14520 (e), and HCCDB18 (f) datasets.
