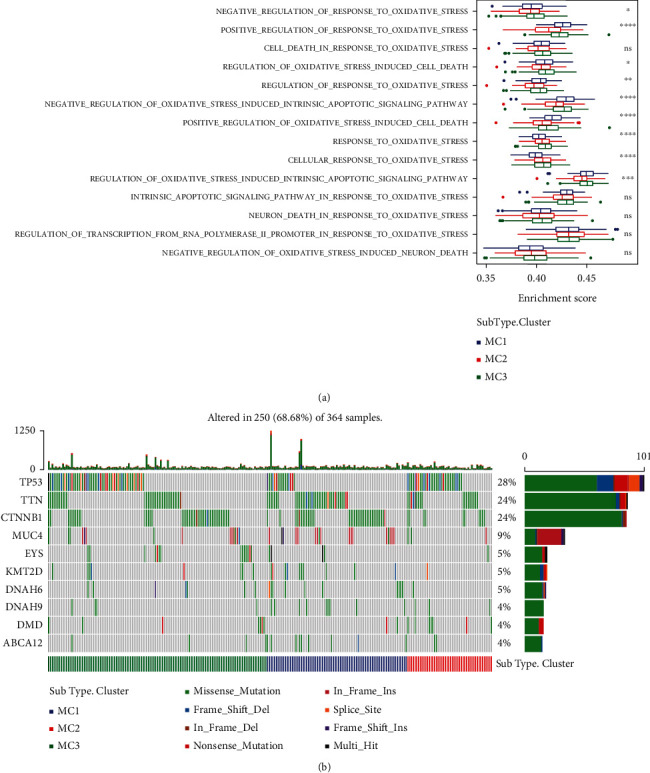
Figure 2.

Differential distribution of oxidative stress in different molecular subtypes. (a) Distribution of 14 oxidative stress-related pathways in three subtypes. (b) The variance in the distribution of the total number of gene mutations found in the samples corresponding to the three different molecular subtypes. The p value was determined with the use of the rank sum test; ∗ is less than 0.05; ∗∗ is less than 0.01.
