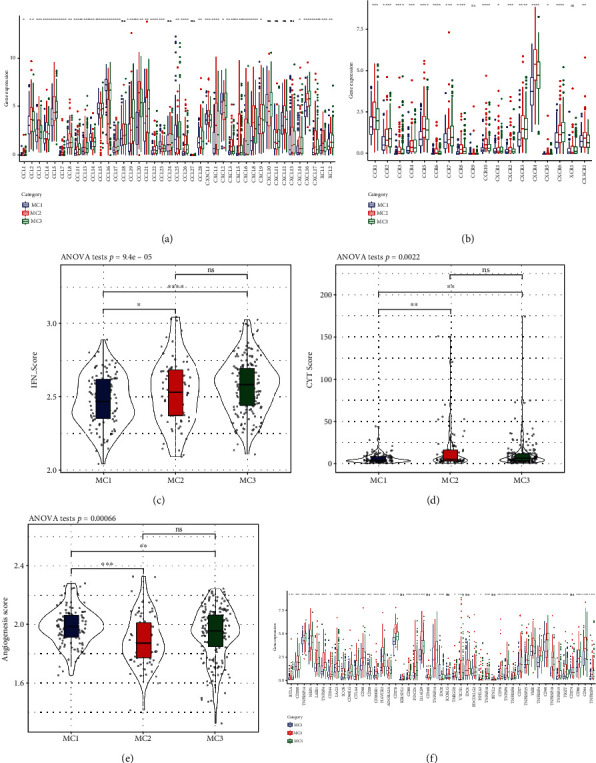
Figure 3.

Expression of chemokines and immune checkpoints in different metabolic subtypes. (a) Variation in the distribution and expression of chemokines in TCGA cohort. (b) Variations in the distribution and expression of chemokine receptors in TCGA cohort. (c) Differences in the IFNγ score distribution across the various subgroups derived from TCGA cohort. (d) Variations in the lysis activity of immune T cells between the two subgroups. (e) Scores on angiogenesis that were variable across the several groups. (f) Variations in the TCGA cohort's immune checkpoint genes both in terms of their expression and their distribution. Analysis of variance was the statistical method that was used to assess the significance. ∗ means p < 0.05; ∗∗ means p < 0.01; ∗∗∗ means p < 0.001; ∗∗∗∗ means p < 0.0001.
