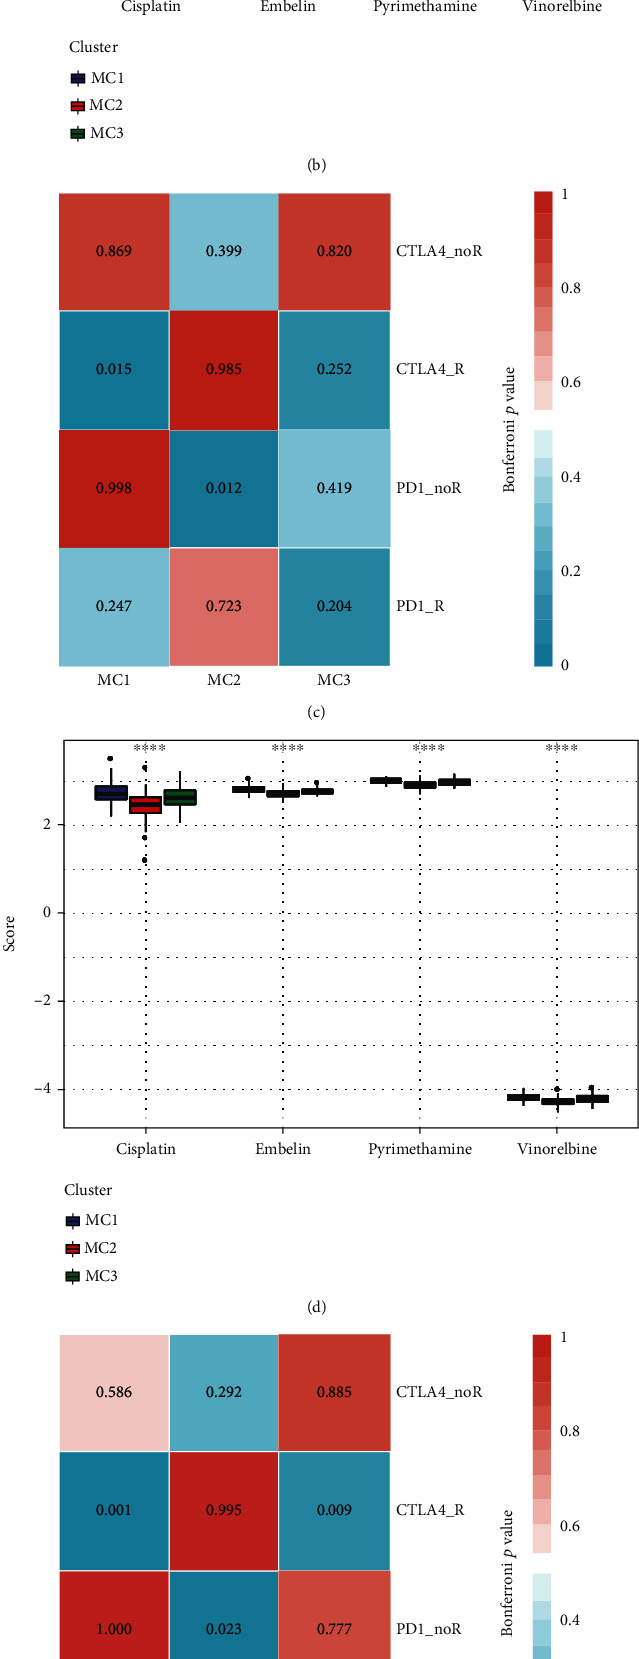
Figure 6.

Differential expressions of immunotherapy/chemotherapy in various metabolic subtypes. (a, b) According to the results of the TCGA submap study, MC1 might be more responsive to CTLA4 (Bonferroni-corrected p < 0.05). Box plots of the estimated IC50 for MC1/2/3. (c, d) The results of the HCCDB18 submap analysis suggested that MC1 might be more responsive to CTLA4 (Bonferroni-corrected p < 0.05). Box plots of the estimated IC50 for MC1/2/3. (e, f) As per the findings of the GSE14520 submap analysis, MC1 might be more responsive to CTLA4 (Bonferroni-corrected p < 0.05). Box plots of the estimated IC50 for MC1/2/3.
