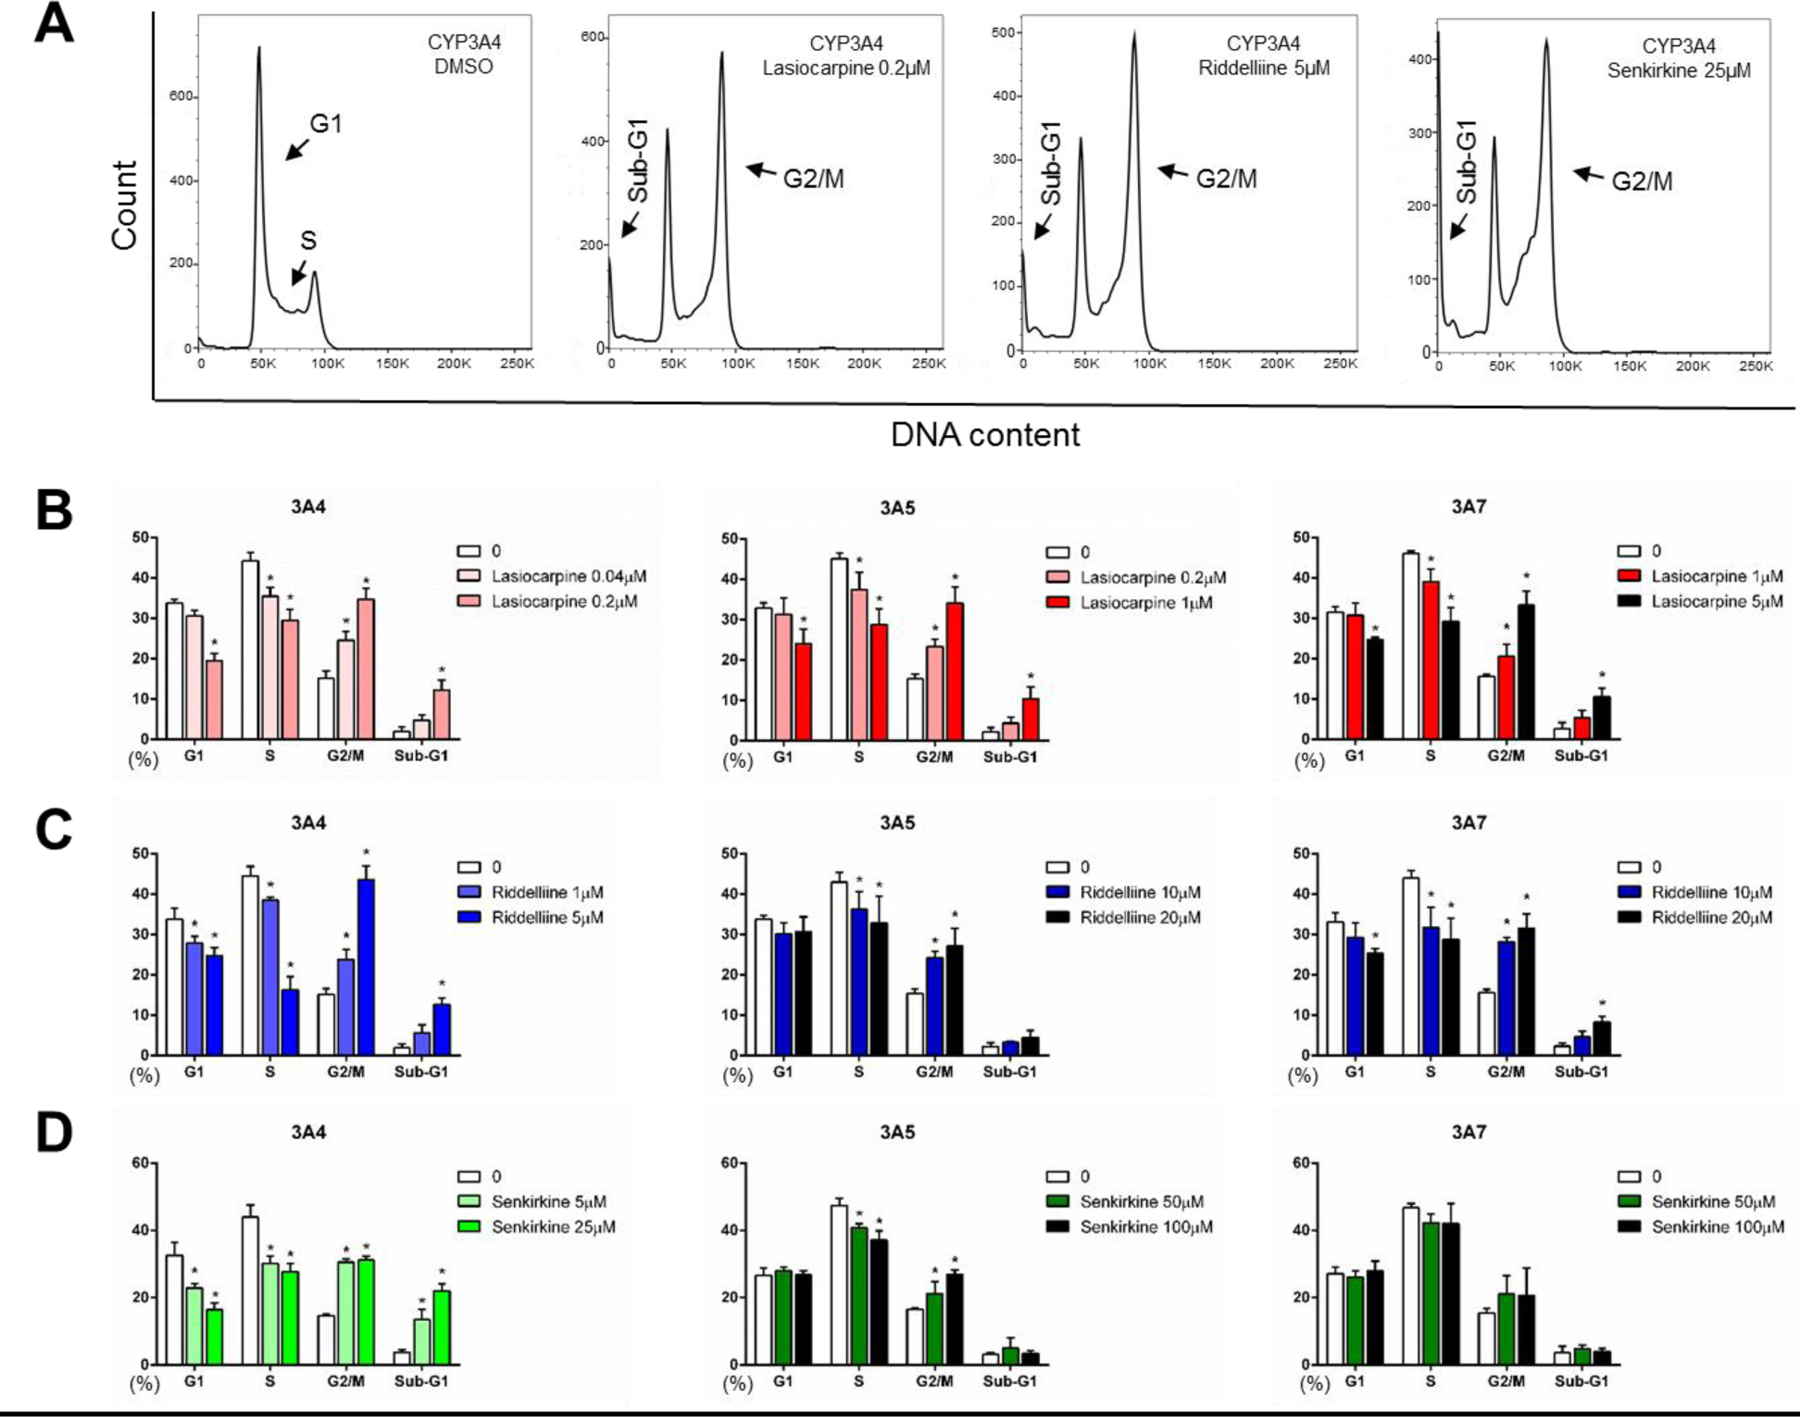
Figure 6.

Cell cycle changes after treatments with 3 PAs in CYP-expressing TK6 cells. Representative images (A) show cell cycle distributions of different samples analyzed by flow cytometry. Histograms are DNA content analyses in the cells treated with lasiocarpine (B), riddelliine (C), and senkirkine (D). The stopping gate was set to record 10,000 intact nuclei. Data were expressed as means ± SD from at least three independent experiments. * indicates P < 0.05 comparing treated groups to DMSO control.
