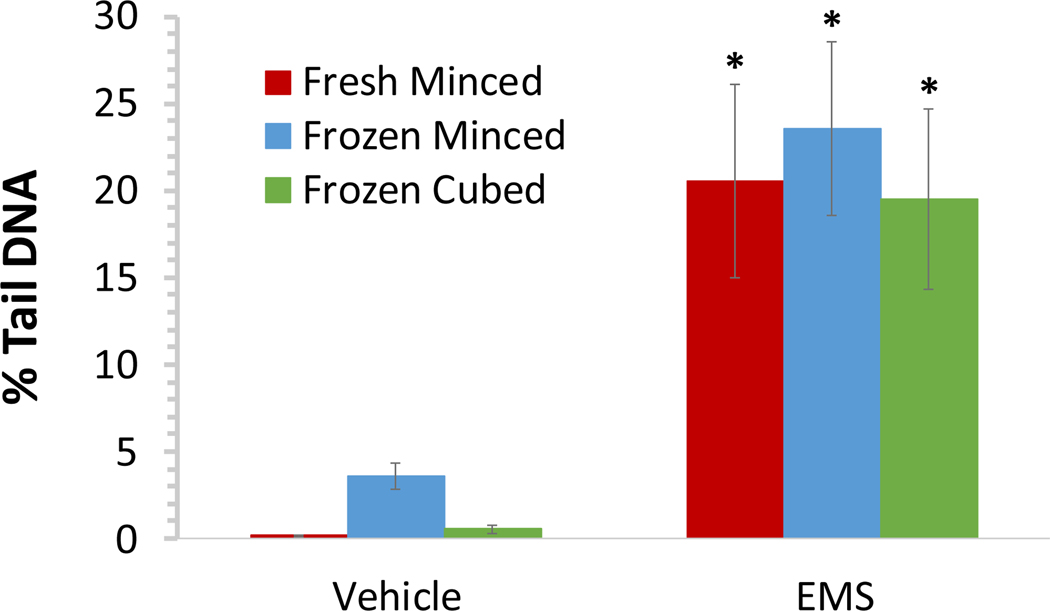
Figure 3: Comparison of DNA damage induced by EMS in Liver tissue processed by different procedures.
Mean % tail DNA for female B6C3F1 mice administered vehicle or 200 mg/kg/day EMS for three days (n = 5/group). Livers were harvested 3 h following the final dose administration and processed fresh in the comet assay. Additional liver tissue was flash frozen after being minced in mincing solution or collected as cubes; cubed samples were homogenized using the tissue mincing device immediately prior to preparation of comet slides. To ensure cells at the high end of the continuum of EMS-induced DNA damage were not excluded from the analysis, comets that upon visual inspection appeared to meet the morphological description of hedgehogs but were found to be scorable by the imaging software were included. Error bars reflect standard deviation. A Student’s t-test was used to compare the amount of DNA damage in animals exposed to EMS against that in the vehicle control animals for each sample preparation method. *Statistically significant increase at p < 0.05.

