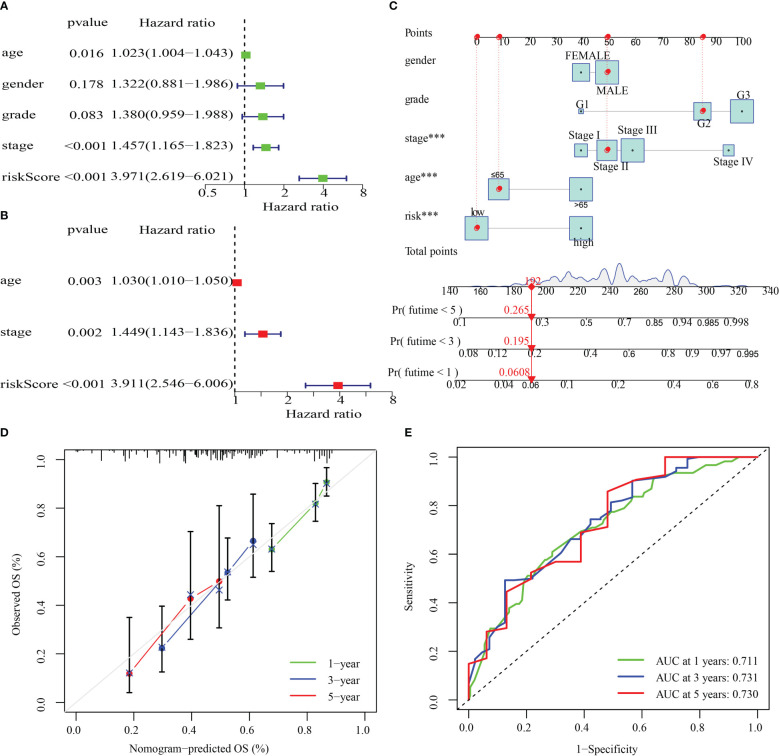
Figure 10.
The development and validation of a risk score-based nomogram. (A, B). Cox regression analysis, both univariate and multivariate, were performed on the training cohort. (D) Calibration curves for validating the nomogram’s capacity to predict outcomes over 1, 3, and 5 years. (E) The ROC curves’ AUC values offer a better assessment of the nomogram’s prognostic capacity. ***P < 0.001.

