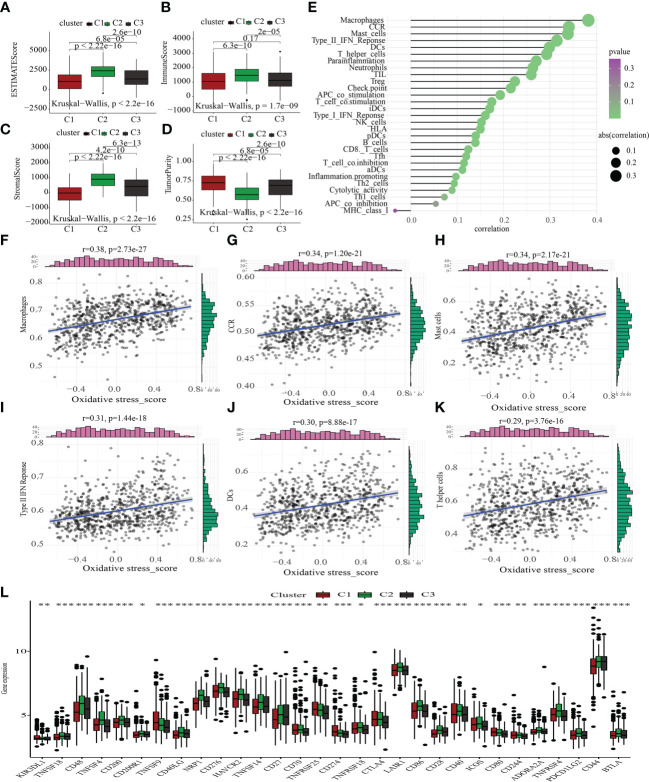
Figure 5.
Comparative immunological status examination of two molecular groups. (A-D) Comparative analysis of the TME components. (E) The plot illustrates the link between the score for oxidative metabolism and the infiltration of immune cells. (F-K) The scatter figure illustrates the link between the oxidative metabolism score and six substances associated with immune infiltration. A favorable correlation was identified between the oxidative metabolism score and the infiltration of macrophages, CCR, mast cells, type II IFN response, DCs, and T helper cells. (L) Comparison of the three subtypes’ immune checkpoint gene expression using a differential analysis method. *P < 0.05; **P < 0.01; ***P < 0.001.

