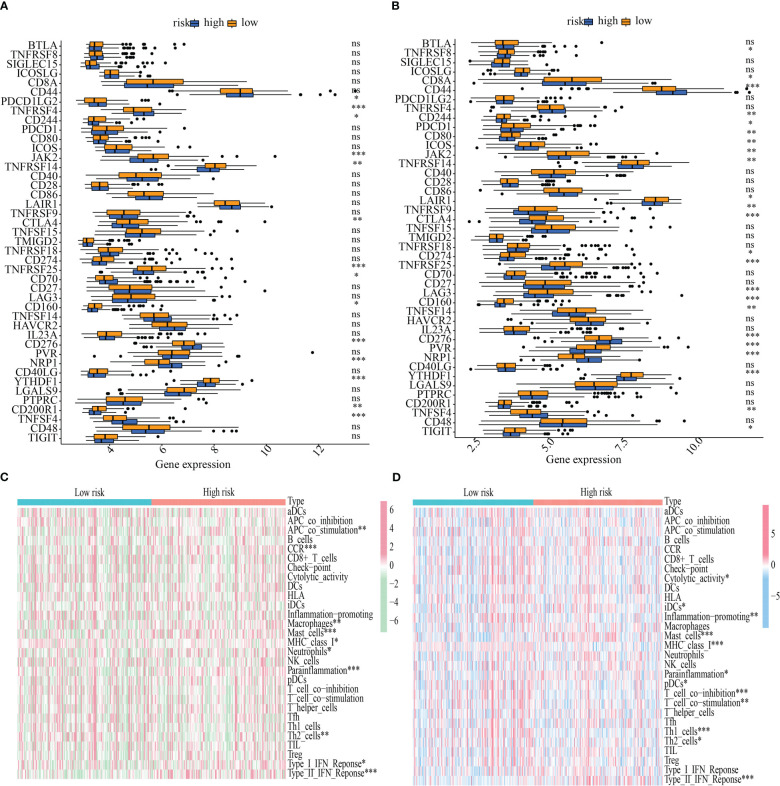
Figure 9.
Immunological function abundance and immune checkpoint gene expression variations in groups with low and high risk. (A-B) Analysis of the differential expression of ICGs between the training and testing cohorts. (C-D) The state of immune function across the training and the testing cohorts. *P < 0.05; **P < 0.01; ***P < 0.001. ns, no significance.

