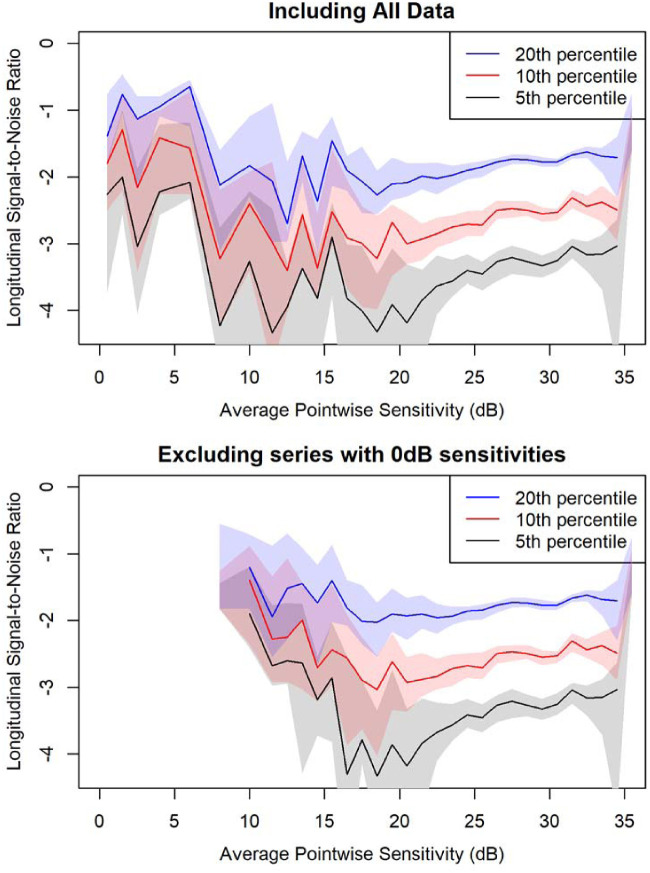
Figure 2.
Quantiles of the distribution of LSNRs, defined as the rate of change from linear regression divided by the standard error of that regression line, in series of six visual fields, among locations with similar mean sensitivity across that series. The 20th, 10th, and 5th percentiles are shown for locations in bins of width 1 dB, except between 3 and 11 dB, where 2-dB-wide bins were used to ensure adequate sample size. The top plot includes all such series. The bottom plot excludes series that contained one or more sensitivities ≤0 dB; only bins including at least 20 series are shown to ensure that the 5th percentile is well defined. The shaded area around each line represents the 95% confidence interval for that line, derived by 1000 bootstrap resamplings of the data in that bin.

