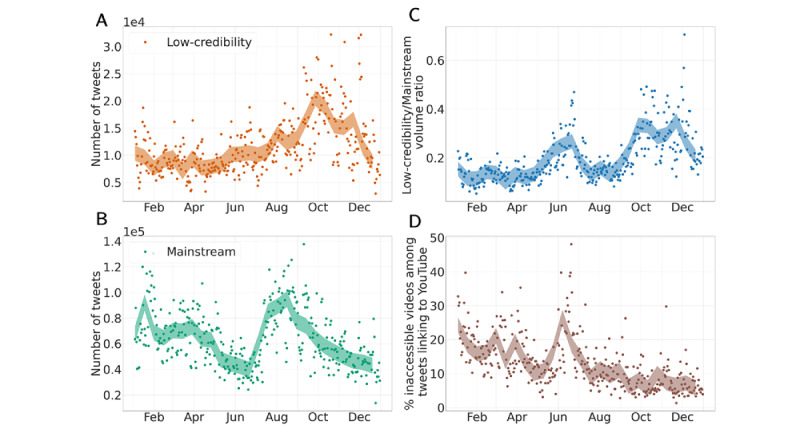
Figure 2.

Timelines of prevalence of vaccine information on Twitter. Trends were evaluated with the nonparametric Mann-Kendall test. Colored bands correspond to a 14-day rolling average with 95% CIs. (A) Daily number of vaccine tweets sharing links to news articles from low-credibility sources. There is a significant increasing trend (P<.001). (B) Daily number of vaccine tweets sharing links to news articles from mainstream sources. There is a significant decreasing trend (P<.001). (C) Ratio between the volumes of tweets sharing links to low-credibility and mainstream sources. There is a significant increasing trend (P<.001). (D) Daily percentage of tweets sharing links to inaccessible YouTube videos among all tweets sharing links to YouTube. There is a significant decreasing trend (P<.001).
