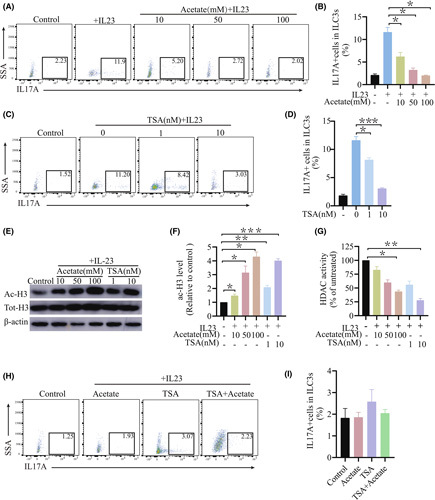
FIGURE 4.

SCFAs inhibited production of IL‐17A by ILC3s in vitro. (A) Representative flow diagram showing intracellular expression of IL‐17A in ILC3s after 48 h of treatment with acetate at different concentrations. (B) Total IL‐17A+ ILC3s after 48 h of treatment assessed in (A) (n ≥ 4). (C,D) ILC3s from the livers of control mice were treated with 40 ng/ml IL‐23 in the presence or absence of acetate or TSA at the indicated concentrations. Representative western blot and relative expression of acetyl‐histone H3 levels after 6 h of treatment. Normalization of data against the total H3. (E) HDAC activity in ILC3 nuclear extracts after 6 h of treatment. (F,G) Flow‐cytometric analysis of the percentage of IL‐17A cells in ILC3s from livers after 48 h of treatment with TSA at different concentrations. Total IL‐17A+ ILC3s after 48 h of treatment in (C) (n ≥ 4). (H) ILC3s from the liver were treated with 50 mmol/L acetate, 40 ng/ml IL‐23, or 10 nmol/L TSA for 48 h. Total IL‐17A+ ILC3s after 48 h of treatment (n ≥ 4). (I) Total IL‐17A+ ILC3s after 48 h of treatment in E (n ≥ 4). ac‐H3, acetyl‐histone H3; SSA, side scattering analysis
