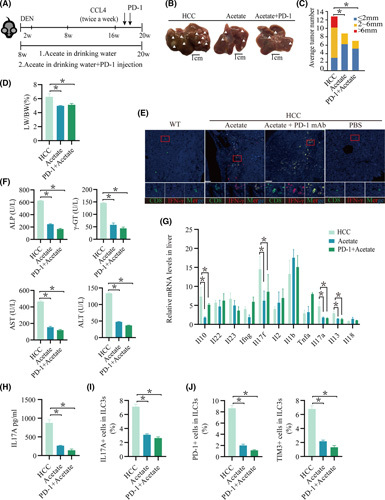
FIGURE 6.

The combination of ICIs with SCFA administration facilitates the immune response in mice with HCC. (A) Schematic plot of the HCC model induced by diethylnitrosamine‐CCl4. PD‐1 (20 mg/kg) was injected twice per week during the last 3 weeks of CCl4 treatment. Mice were given drinking water containing acetate from 16 weeks of age for 20 weeks. IL‐17A levels in the supernatant of in vitro–cultured ILC3s treated with acetate (n ≥ 4/group). (B) Macrograph of livers in HCC mice kept with HCC (left), with acetate (second from left), and with PD‐1+acetate (right). Arrowheads indicate HCCs. (C,D) The liver weight to body weight ratio was analyzed, and the average number of liver tumors and the relative size distribution were divided into ≤ 2 mm, 2–6 mm, and >6 mm (p < 0.01). (E) Expression of CD8 and interferon‐γ in tumor tissue was determined by immunohistochemistry. (F) Hepatic function indexes: ALP, AST, ALT, γ‐GT. (G) Measurement of Il22, Ifng, Il10, Il13, Il17a, Il17f, Il18, Il1b, Il2, Il23, and Tnfa mRNA expression levels in livers by real‐time quantitative PCR (n ≥ 3; *p < 0.05). (H) IL‐17A levels in the serum of acetate, PD‐1+acetate, and HCC mice (n ≥ 3 mice/group). (I) Percentage of IL‐17A cells in ILC3s from the liver (n ≥ 4). (J) Percentage of PD‐1 or TIM‐3 cells in ILC3s from the liver (n ≥ 4). DEN, diethylnitrosamine; LW/BW, liver weight to body weight ratio; mAb, monoclonal antibody
