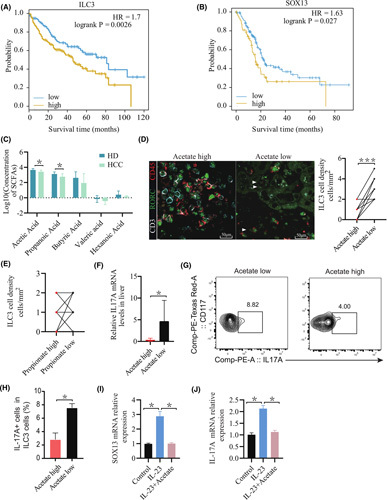
FIGURE 7.

Acetate negatively correlates with hepatic ILC3 infiltration in individuals with HCC. (A) Kaplan‐Meier curves of OS based on ILC3 cell frequencies in The Cancer Genome Atlas ILC3 cell gene list (KIT, CXCL8, IL4I1, IL1R1, MAFF, RUNX3). (B) Kaplan‐Meier curves of OS based on Sox13 expression in HCC in The Cancer Genome Atlas. (C) Levels of portal vein serum SCFAs of acetate, propionate, butyrate, valerate, and caproate were detected in individuals with HCC (n = 8) and healthy donors (n = 15). p values were determined by the two‐tailed Mann‐Whitney U test. (D,E) Representative graphs of ILC3 cell distribution in tumor tissues. The method was used to define the subset as CD45+CD3‐RORγt+ cells. Compared with the acetate‐high group and the acetate‐low group (D) or compared with the propionate‐high group and the propionate‐low group (E), the absolute number of ILC3 cells was significantly reduced in the acetate‐high group (p < 0.001; n = 10). (F) Measurement of IL‐17A mRNA expression levels in livers by real‐time quantitative PCR in individuals in the acetate‐high group (n = 3) and the acetate‐low group (n = 4) (*p < 0.05). (G,H) Human ILC3s were sorted from peripheral blood mononuclear cells of patients with HCC. (G) The percentage of peripheral blood IL‐17A+ cells in ILC3 cells was determined by flow‐cytometric analysis. (H) Representative graphs of IL‐17A+ILC3 cells in patients with high levels of serum acetate and those with low acetate levels (n ≥ 3) (*p < 0.05). (I,J) Human ILC3s were sorted from healthy donor peripheral blood mononuclear cells and cultured with IL‐2 (10 ng/ml) and IL‐7 (10 ng/ml) in the presence or absence of acetate or IL‐23 (100 ng/ml). IL‐17A and Sox13 mRNA expression levels of ILC3s after 2 days of treatment (n ≥ 3) (*p < 0.05). HD, healthy donors; RORC, ROR complex
