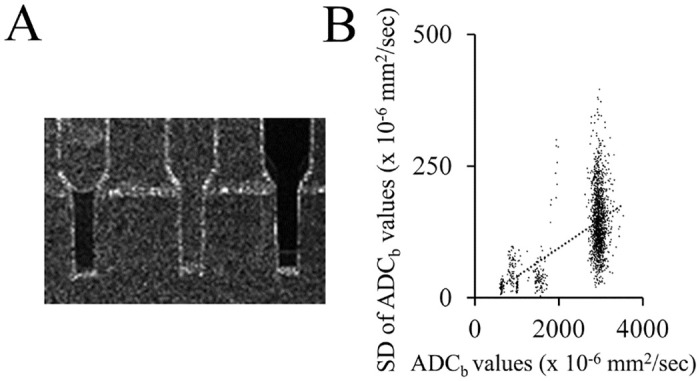
Fig 4. Relationship between ADC values and their SD.

(A) SD image of the ADCb values of different phantoms. High-cellularity bio-phantom, physiological saline phantom and 120 mM polyethylene glycol phantom were indicated from left to right. (B) Scatter graph indicating the correlation between the values of ADCb and SD of ADCb. The dotted line indicates a positive correlation as a result of linear regression. ADC, apparent diffusion coefficient; ADCb, ADC basic; SD, standard deviation.
