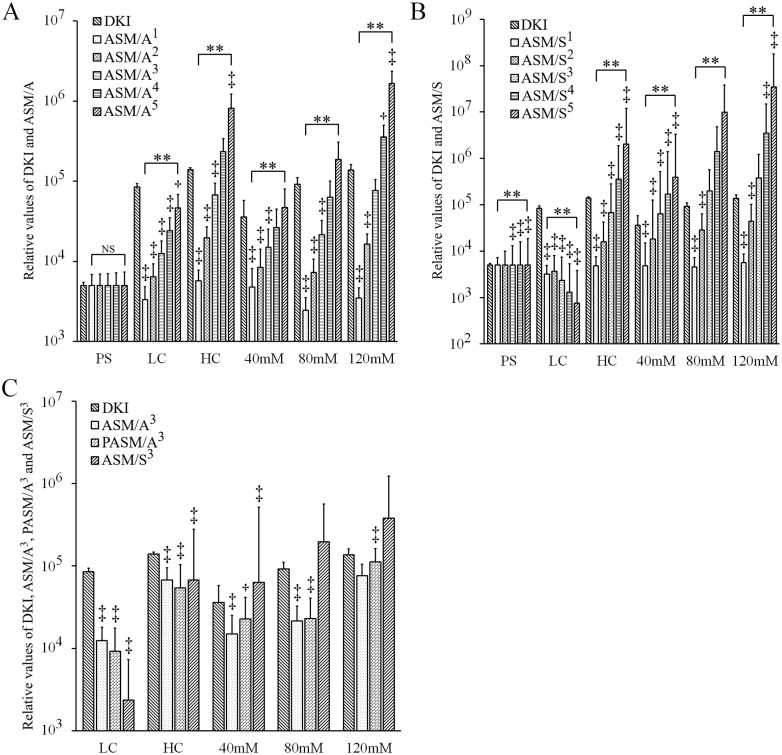
Fig 5. Comparison of the relative values for various phantoms among the DK image and ASM images.
(A) ASM/A images. (B) ASM/S images. (C) ASM/A3, PASM/A3 and ASM/S3 images. Phantoms used were bio-phantoms of Jurkat cells and polyethylene glycol phantoms. Vertical bar represents relative values of DK image and ASM images, which were modified for their PS values to become 5,000. Error bar represents standard deviation for each value. +P<0.05 and ‡P<0.01, Dunn’s method added to Kruskal-Wallis test for comparison between values of DK image and each ASM image. **P<0.01 and NS, not significant by Kruskal-Wallis test for comparison among the values of ASM images. ADC, apparent diffusion coefficient; ASM, ADC subtraction method; PS, physiological saline; LC, low-cellularity; HC, high-cellularity; DKI, diffusion kurtosis imaging; ASM/Ax, ASM division by ADC x times; ASM/Sx, ASM division by standard deviation x times; PASM/A3, positive ASM division by ADC three times.

