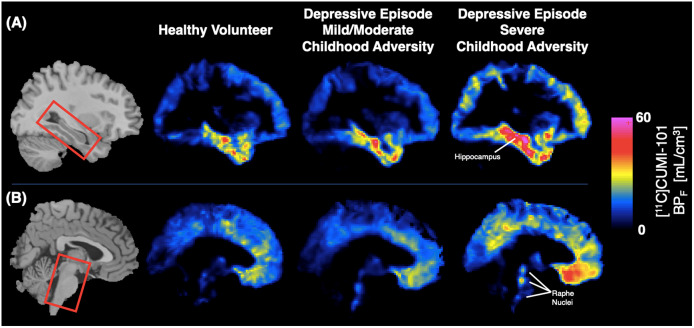
Figure 2.
Representative [11C]CUMI-101 voxel maps of BPF (mL/cm3) from each group, highlighting the hippocampus (A) and raphe nuclei (B). All images shown in Montreal Neurological Institute (MNI) space. Template MRI shown at left and a representative participant’s PET voxel map from each group shown in the right three columns.

