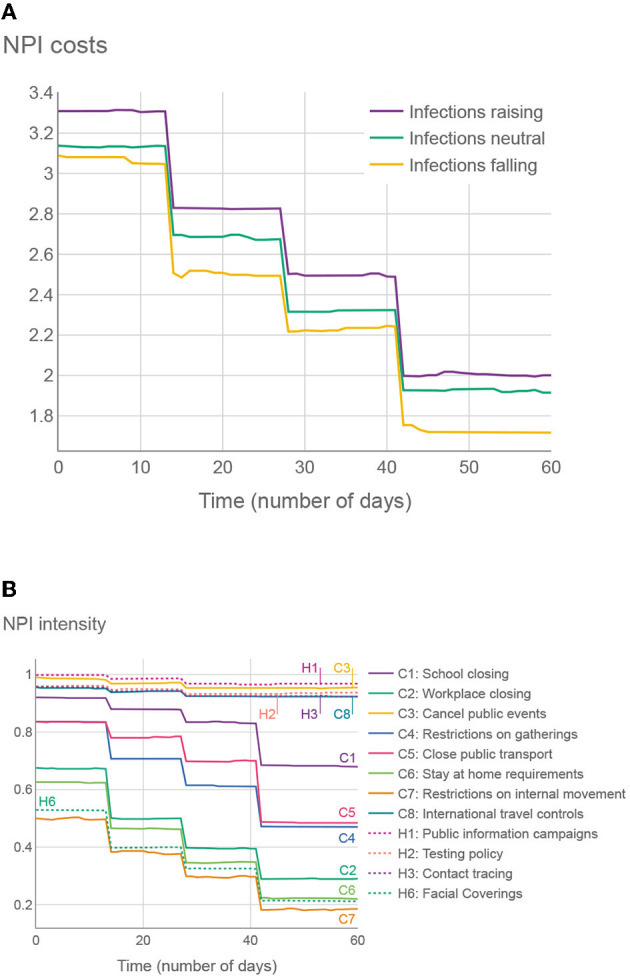
Figure 7.

(A) Average SEC across all 500 proposed intervention plans (50 test cases, 10 plans on each), given the number of days since the intervention has started. (B) Average OxNPI strictness (normalized to 0-1 range) across all 500 proposed intervention plans, given the number of days since the intervention has started.
