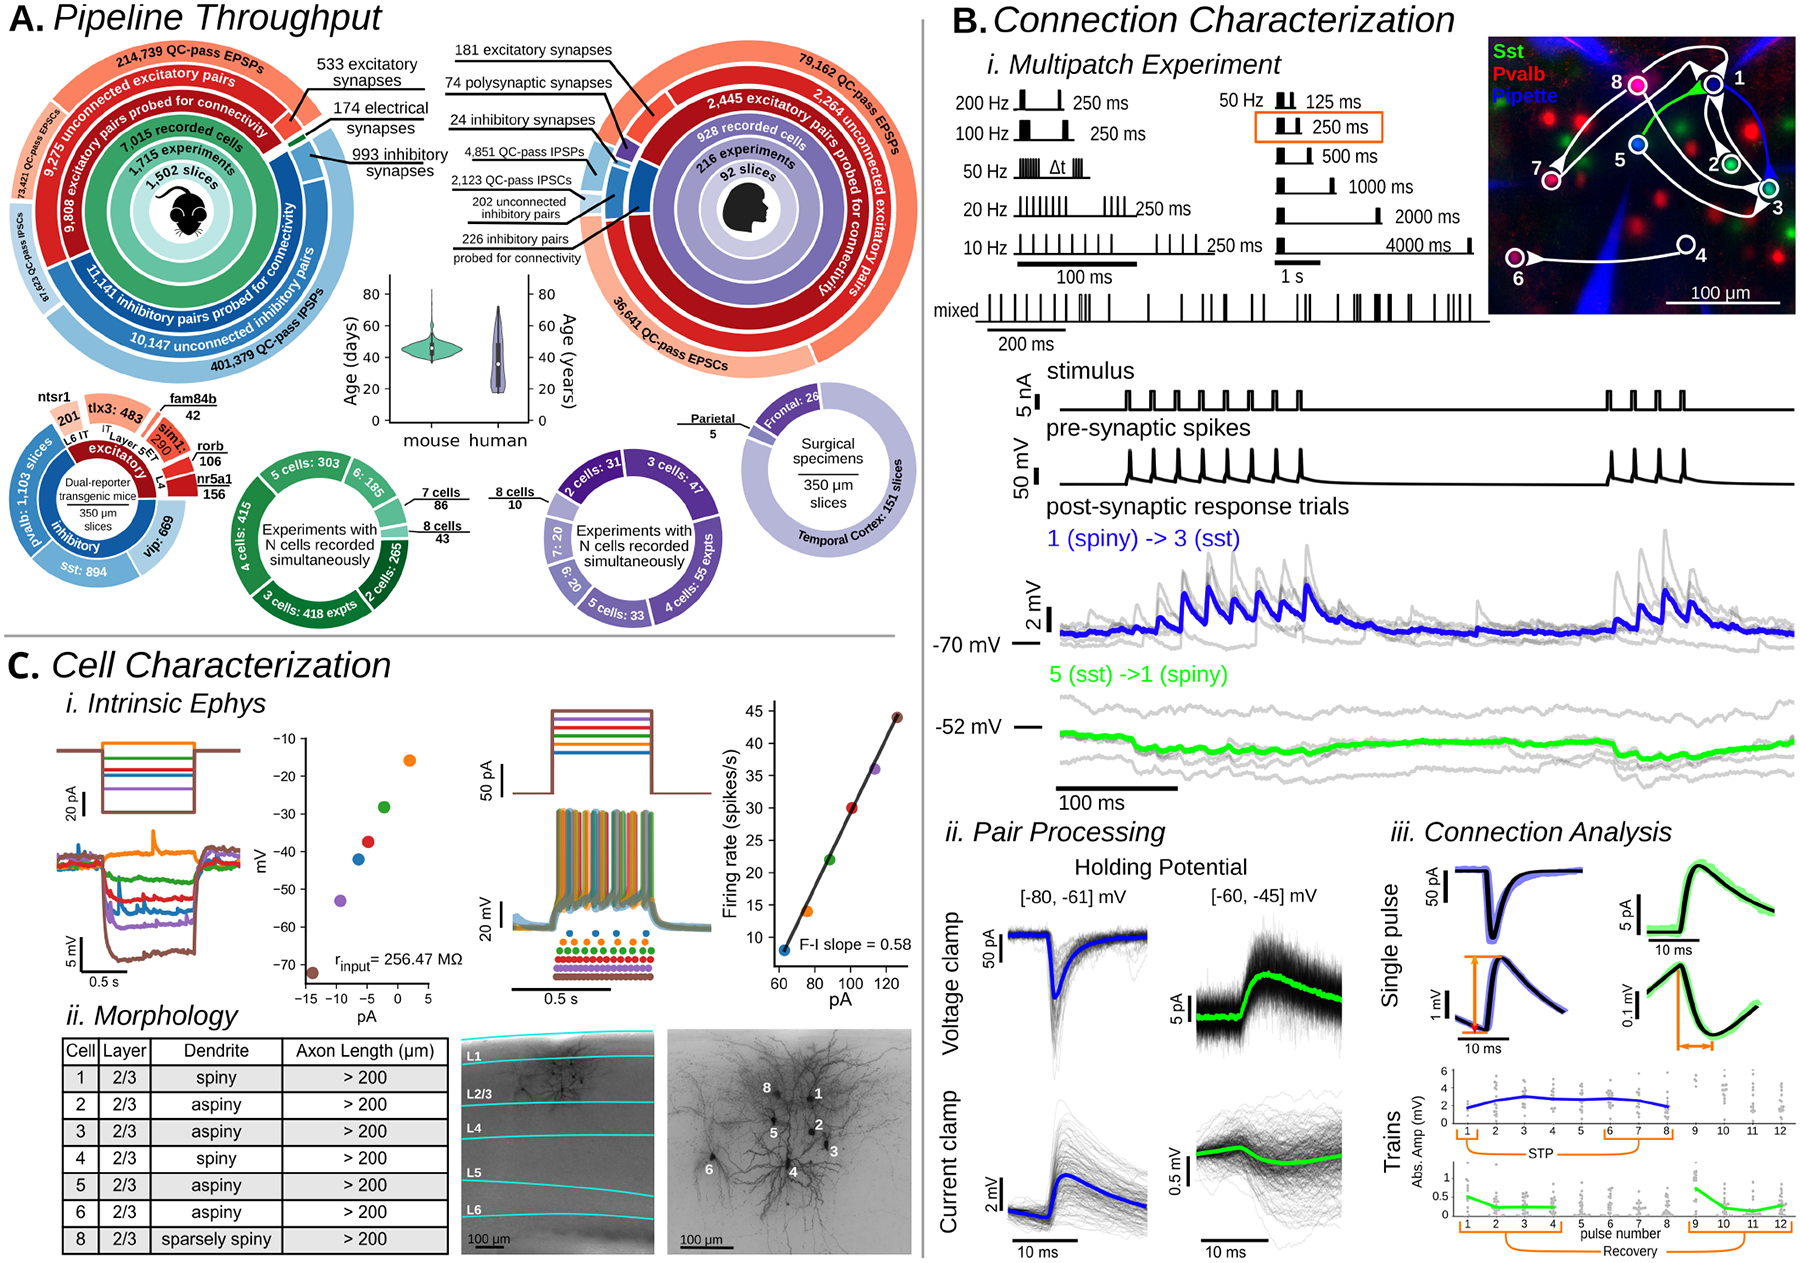
Fig. 1. Synaptic Physiology Pipeline:

A. Pipeline throughput summary. Large circles: data collection statistics (mouse primary visual cortex;left, human;right). Age distribution for each species (center). Distributions of recorded cells (bottom, outer circles). Experiment count with 2 through 8 simultaneously recorded cells (bottom, inner circles) B. i.Multipatch Experiment: Stimuli sets used to probe connectivity and dynamics (top). Fluorescent image (right) shows recorded cells with connectivity diagram overlaid. Example electrophysiology recordings of cells 1, 3, and 5 during the 50 Hz stimulus (orange box). ii.Pair Processing: For each recorded pair presynaptic-spike aligned postsynaptic responses (black traces) were overlaid and averaged (colored trace corresponding to the same connection in Multipatch Experiment panel) in both voltage clamp (top row) and current clamp (bottom row). From this a connection could be identified. iii Connection Analysis: When a connection was identified the average (colored) was fit (black) and metrics such as amplitude and rise time (orange lines) were extracted from the fit. Short term plasticity (STP) was quantified as a ratio from fits of individual PSPs. C. i Intrinsic Ephys: Long pulse steps were applied to quantify intrinsic cell properties, and electrical connections (Figure S4). Hyperpolarizing steps (left) delivered to an example cell probed the subthreshold I-V relationship to quantify metrics such as input resistance while depolarizing suprathreshold sweeps (right) were used to measure spiking and firing rate properties. ii Morphology: Cells were filled with biocytin during recording and stained. 20x images of the full slice stained with DAPI allowed identification of the cortical layers and 63x z-stack images were used to assess morphological properties such as dendritic type and axon length. Images and cells here are the same as in (B).
