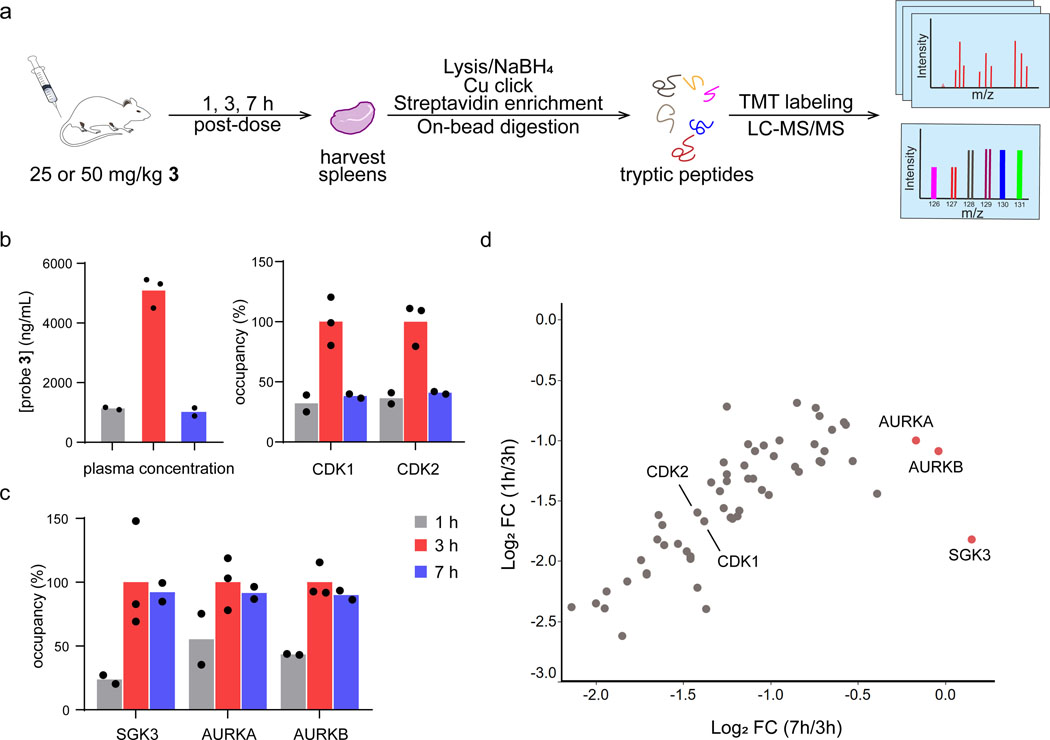
Figure 5.
Quantifying kinase occupancy by salicylaldehyde 3 in mice. (a) Mice were dosed with vehicle or probe 3 (25 or 50 mg/kg) by subcutaneous injection. At 1, 3, and 7 h post-dose, plasma and spleens were collected for quantification of probe 3 concentrations and kinase occupancy, respectively. Spleens from each time point were selected for chemoproteomic analysis (biotin-azide conjugation, streptavidin pulldown, 10-plex TMT quantitation) based on the probe 3 plasma levels quantified from the same mice (see main text and Supplementary Table 2). Spleens from vehicle-treated mice were collected at t=7 h post-injection. (b-c) Plasma concentrations of probe 3 and relative occupancy of the indicated kinases (normalized to t=3 h) are plotted for each time point (t=1 and 7 h, n=2; t=3 h, n=3). (d) Scatter plot comparing relative kinase occupancy (log2 fold-change vs. kinase occupancy at t=3 h) at t=7 h vs. t=1 h. Each circle represents one kinase, with AURKA, AURKB, and SGK3 showing the highest occupancy at t=7 h, despite decreased plasma levels of probe 3.

