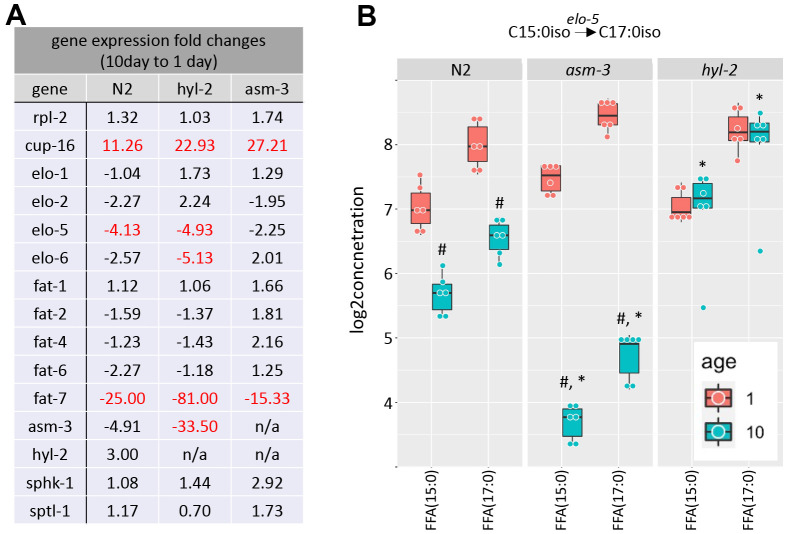
Figure 6.
Saturated and polyunsaturated fatty acids metabolism. (A) Table of gene expression for fatty acid for elongases and desaturates examined in 1-day and 10-day old N2, asm-3, and hyl-2 animals by quantitative PCR. Data are represented by 2-ddCT fold change of 10-day N2 compared to 1-day values (n=3 for each group, red indicates fold changes that are p<0.01). The reference gene was rps-2, and rpl-2 and cup-16 are control genes known to remain unchanged and increase, respectively, in older animals. (B) Log2 concentrations of FFA(15:0) and FFA(17:0) are shown at 1- and 10-day old N2, asm-3, and hyl-2 animals (n=6 for each group). For all, #indicates p<0.05 compared to 1-day counterpart of the same genotype. *indicates p<0.05 compared to N2 counterpart of the same age.

