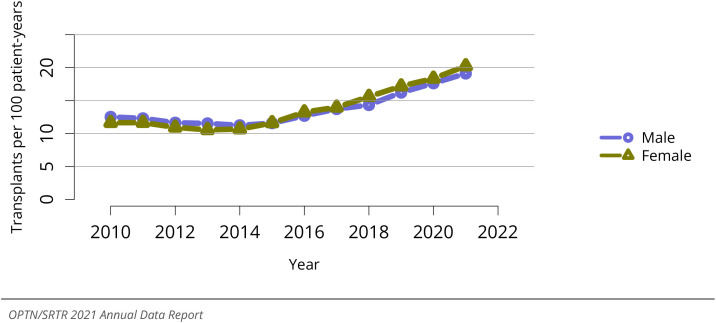
Figure KI 22.
Deceased donor kidney transplant rates among adult waitlist candidates by metropoli- tan vs. non-metropolitan residence. Transplant rates are computed as the number of deceased donor transplants per 100 patient-years of wait time in a given year. Individual listings are counted separately. Metropolitan/non-metropolitan determination is made using the RUCA (rural-urban commuting area) des- ignation of the candidate’s permanent zip code.

