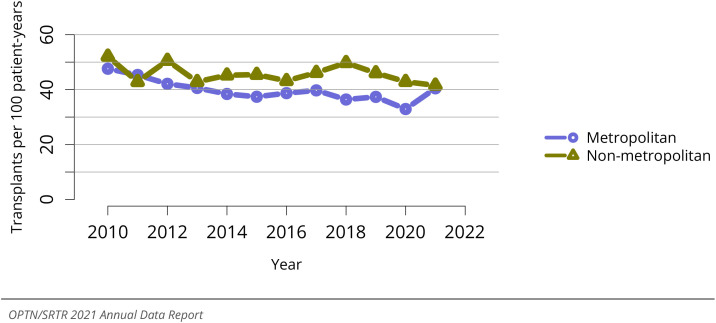
Figure KI 115: Deceased donor kidney transplant rates among pediatric waitlist candidates by metropolitan vs. non-metropolitan residence. Transplant rates are computed as the number of de- ceased donor transplants per 100 patient-years of waiting in a given year. Individual listings are counted separately.

An official website of the United States government
Here's how you know
Official websites use .gov
A
.gov website belongs to an official
government organization in the United States.
Secure .gov websites use HTTPS
A lock (
) or https:// means you've safely
connected to the .gov website. Share sensitive
information only on official, secure websites.
