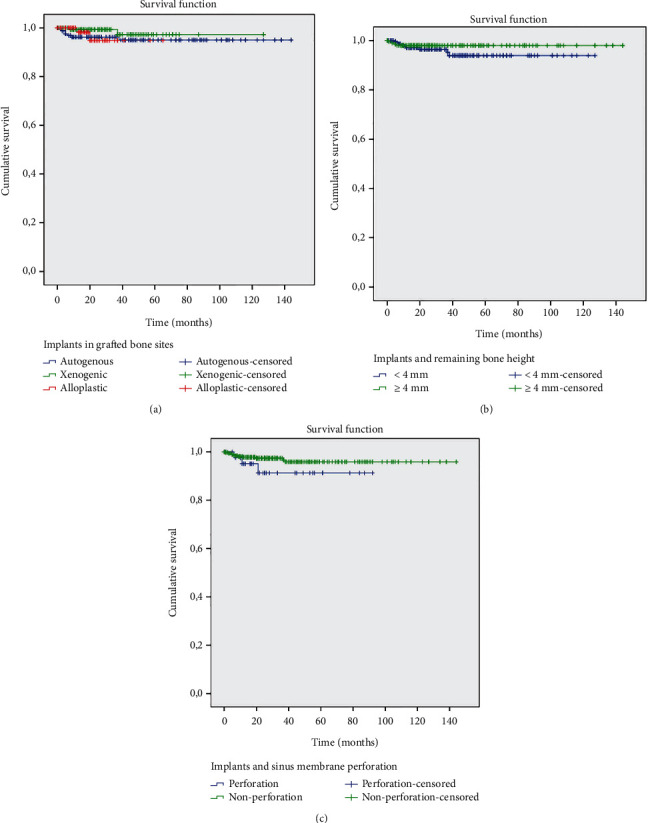
Figure 4.

The Kaplan-Meier survival analysis. (a) Survival rate of the implants in grafted bone sites: autogenous, xenogenic, and alloplastic. (b) Relation between implant survival rates and remaining bone height: <4 mm and ≥4 mm. (c) Relation between implant survival rates and sinus membrane perforation.
