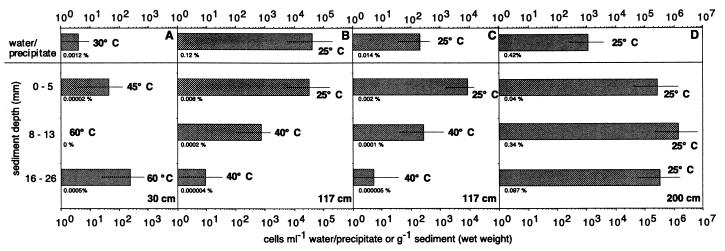
FIG. 5.
MPN counts of SOB at 30 cm (A), 117 cm (B and C), and 200 cm (D) from the vent center in September 1996. The bars indicate the 95% confidence interval. The incubation temperature and the percentage of the total cells accounted for by the MPN counts are given beside and below the bars, respectively. The two cores at 117 cm were obtained 1 week apart. During the first sampling, a white precipitate was present on the sediment surface (B), whereas during the second sampling, it was absent (C). The MPN series for the second core (C) was performed with medium with an increased salinity of 55‰.

