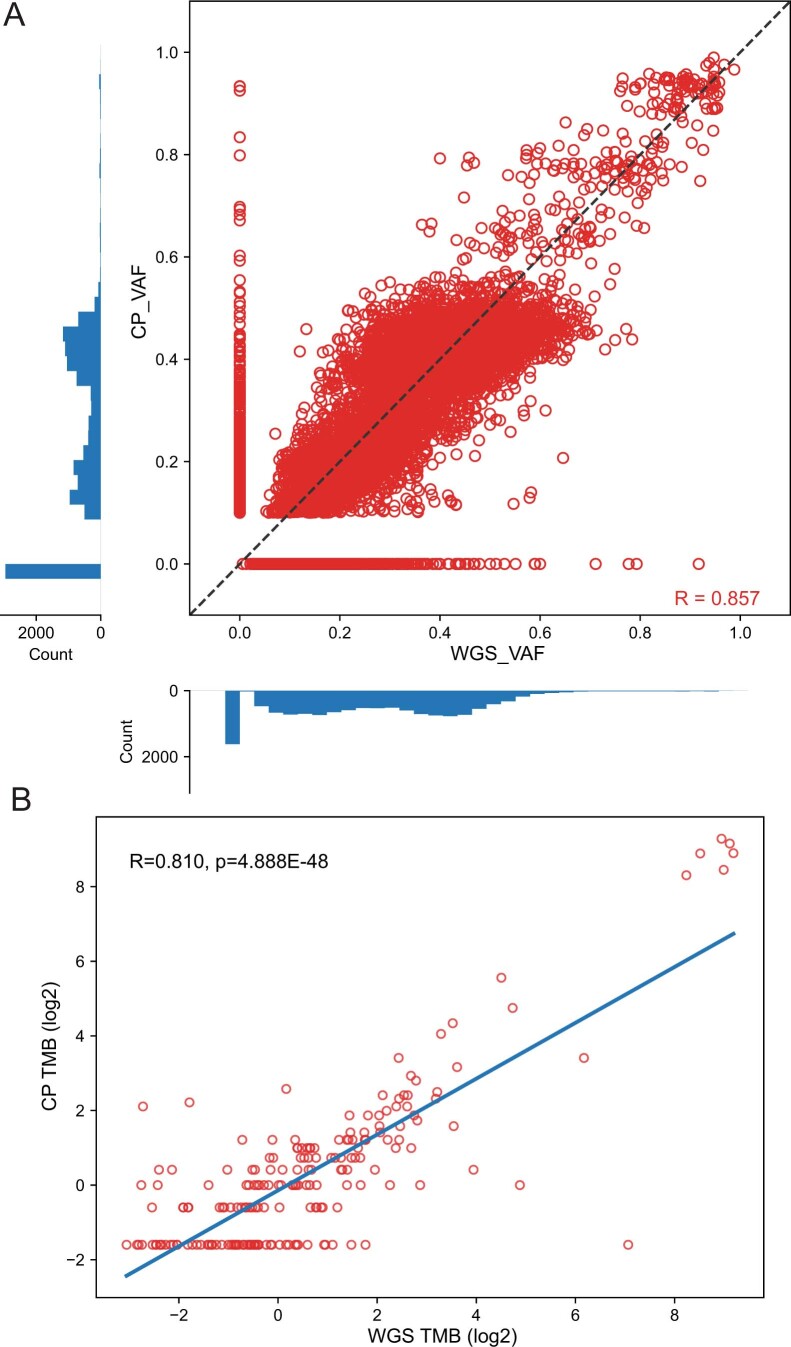
Extended Data Fig. 10. Agreement between whole genome and cancer panel tumor mutation burden.
(a) Scatter plot of variant allele fraction from variants discovered on cancer panel target regions from 242 tumors from 193 patients detected on both cancer panel sequencing and whole genome sequencing. Axis plots are count histograms of variants at certain variant allele fraction bins. Variants discovered from one platform, but not the other, have the NULL value replaced with zero to allow plotting of the point, but these variants were not used within the correlation calculation. (b) Correlation of cancer panel tumor mutation burden to whole genome sequencing tumor mutation burden across 201 tumor samples. Only samples where cancer panel tumor mutation burden was greater than zero are plotted due to log conversion. Line indicates linear regression fit of these samples, Pearson (two sided) correlation R = 0.810, p = 4.888E−48. The Pearson (two sided) correlation and significance of non-log transformed data, including cancer panel samples with TMB of zero (303 tumor samples) was R = 0.956, p = 6.281E−149.

