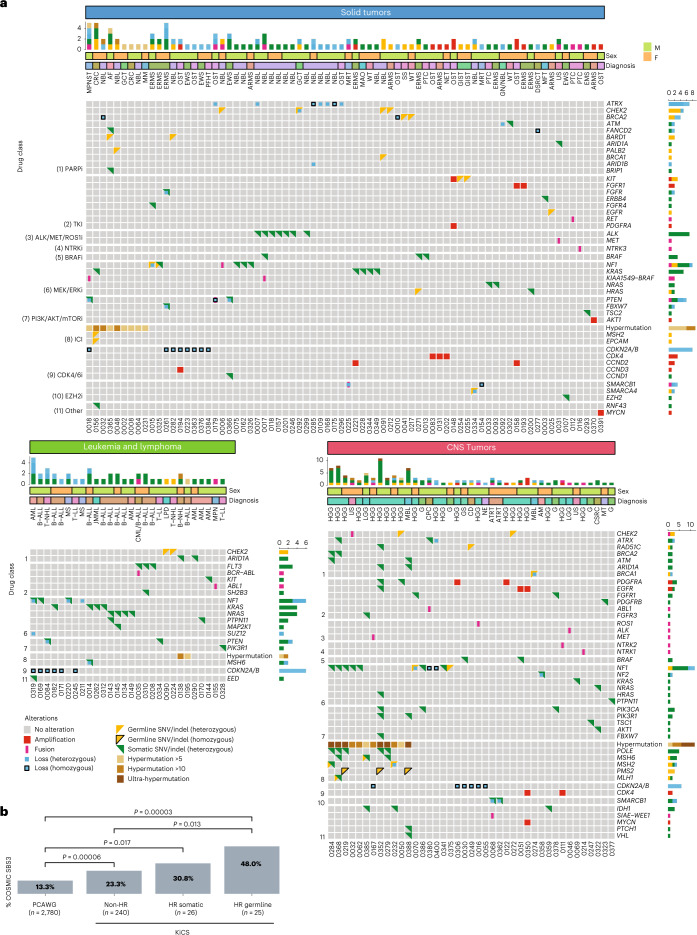
Fig. 3. Oncoprint visualization of category C (therapeutic) clinically actionable findings and BRCAness in pediatric and AYA cancers in the KiCS cohort.
a, Oncoprint visualization of the distribution of therapeutically actionable findings (category C). Findings are arranged in rows and grouped by the therapeutic agent indicated by each finding. Patients (n = 143; two patients with two primary tumors each represented twice) are arranged in columns. The top bar plot indicates the number of relevant mutations in each patient (that is, the number of variants that constitute therapeutic biomarkers in each patient). Some variants contribute together as a single actionable finding, for example, PTEN SNV and PTEN loss in KiCS 366 and MSH2 germline and somatic SNVs, POLE SNV and ultra-hypermutation in KiCS 284. Variant details are depicted in Supplementary Table 5. The right-side bar plot depicts the number of patients harboring a finding. Red square, amplification; blue square, loss; pink vertical rectangle, fusion; yellow triangle, germline SNV/indel; green triangle, somatic SNV/indel; black border, homozygous mutation; brown square, hypermutation. Please see Supplementary Table 1 for a full list of tumor types and acronyms. b, The proportion of COSMIC single-substitution signature 3 (BRCAness mutational signature) in the PCAWG dataset compared to KiCS cohort patients with absence or presence of either somatic or germline variants affecting the HR pathway. The KiCS cohort is divided into three subsets based on the absence or presence of germline or somatic HRD. The proportion of samples with the SBS3 signature in each KiCS subset as well as the PCAWG dataset is shown by the height of the bars. Sample sizes (that is, the number of biologically independent samples) are shown on the x axis. Only statistically significant P values obtained by Fisher’s exact test (two sided) comparing each pair of datasets are shown.

