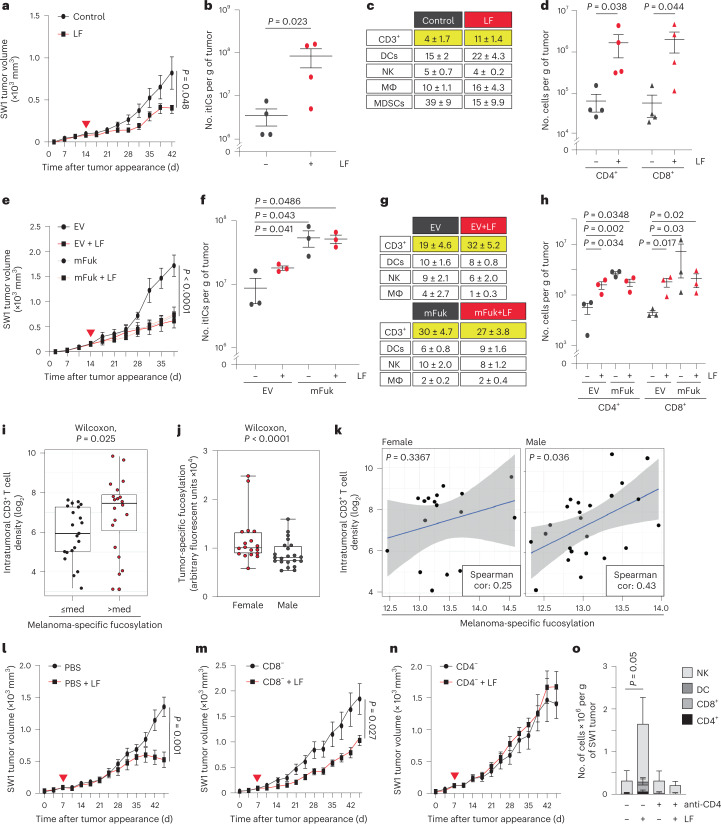
Fig. 1. Increasing melanoma fucosylation reduces tumor growth and increases itIC abundance, particularly CD4+ and CD8+ T cells.
Volumetric growth curves, total itIC counts, percent itIC subpopulations (CD3+ T cells, DCs, NK cells, macrophages (MΦ) and MDSC-like (MDSC) cells) and intratumoral CD3+CD4+ (CD4+) and CD3+CD8+ (CD8+) T cell counts of SW1 tumors (a–d, respectively) or of empty vector (EV)- or mFuk-expressing SW1 tumors (e–h, respectively) in C3H/HeN mice. Red triangle, initiated l-fuc (LF) supplementation. The growth curves show mean ± standard error of the mean (s.e.m.) from groups of mice as follows: n = 11 control and n = 10 l-fuc-fed mice (a), n = 4 mice per group (b,d), n = 7 mice per group (e), n = 3 mice per group (f,h)(b,d,f,h show mean ± s.e.m.). i, Association of melanoma-specific fucosylation and CD3+ T cell density (log2 scale) in a 40-patient melanoma tissue microarray (med = median fucosylation signal per melanoma cell). j, Box plots showing lower melanoma-specific fucosylation in male (n = 22) versus female (n = 18) patients. The minima and maxima represent the minimum and maximum tumor fucosylation values while the centra represent median values. P values shown are two-sided P values derived from the Spearman correlation test. k, Scatterplots show higher correlation (cor) between melanoma-specific fucosylation and CD3+ T cell density (log2 scale) in male (Spearman’s ρ = 0.43; P = 0.036) versus female (Spearman’s ρ = 0.25; P = 0.3367) patients. The gray bands highlight 95% confidence bands for the prediction line (based on linear regression). Volumetric growth curves for SW1 tumors in PBS (control)-injected (both (control and l-fuc) groups, n = 7 mice) (l), CD8+ T cell- (both groups, n = 6 mice) (m) or CD4+ T cell- (n) immunodepleted C3H/HeN mice (both groups, n = 7 mice). o, Comparison of intratumoral NK, DC, CD8+ T and CD4+ T cell subpopulations (absolute cell numbers) from tumors (n = 4 (control) and n = 3 (l-fuc)) (l), (for both groups, n = 4) (n). All error bars represent s.e.m. With the exception of e, for which one-way ANOVA was performed, two-sided t-tests were performed for all other analyses.

