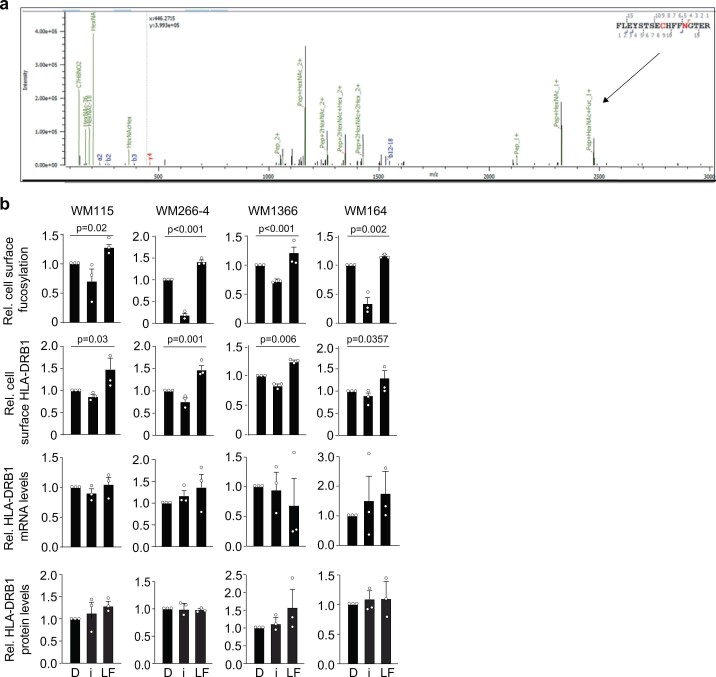
Extended Data Fig. 4. nano-LC/MS spectral identification of fucosylated HLA-DRB1 peptide; and the effects of modulating fucosylation on HLA-DRB1 localization, total protein, and mRNA levels.
(a) nano-LC/MS/MS spectra showing fucosylated HLA-DRB1 peptide (arrow). (b) Flow cytometric analysis for relative cell surface fucosylation (upper) and cell surface HLA-DRB1 levels (upper middle), qRT-PCR analysis of relative HLA-DRB1 mRNA levels (lower middle), and IB analysis of HLA-DRB1 protein levels (lower) in indicated melanoma cell lines treated with DMSO (D), 250 µM FUTi (i), or 250µM L-fuc (LF). n = 3 biologically independent experiments. All error bars represent standard error of the mean.

