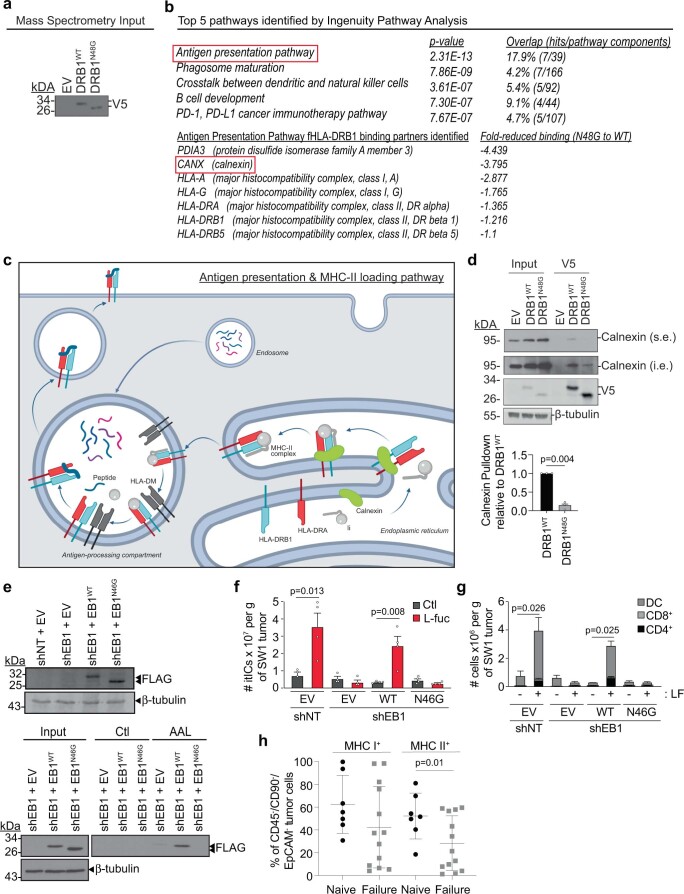
Extended Data Fig. 5. Proteomic analysis reveal fuco/glycosylation of HLA-DRB1 decreases binding to calnexin; knockdown/reconstitution and fucosylation of EB1 WT and N46G and its effects on itICs in vivo; loss of MHCII is associated with anti-PD1 failure in melanoma patients.
(a) IB analysis of 5% input of V5 IP of tagged EV, HLA-DRB1WT, and HLA-DRB1N48G mutant in WM793 melanoma cells. (b) (top) Top 5 pathways that are affected by HLA-DRB1 fuco/glycosylation identified by Ingenuity Pathway Analysis (Qiagen). (bottom) Individual proteins in the Antigen Presentation Pathway identified in the screen. (c) Schematic of proteins identified in the Antigen Presentation & MHC-II Loading Pathway. The schematic was created using BioRender.com. (d) (top) IP of EV, HLA-DRB1WT, and HLA-DRB1N48G and IB analysis of calnexin (short exposure (s.e.), calnexin (intermediate exposure (that is), V5, and β-tubulin. (bottom) Quantification of calnexin band intensity to V5 intensity in V5 IP lanes (relative to HLA-DRBWT; (n = 3 biologically independent experiments). (e) (upper) IB analysis of non-targeting shRNA + empty vector (shNT + EV) or shEB1-expressing cells (from Extended Data Fig. 3b) reconstituted with FLAG-EV (shEB1 + EV), FLAG-EB1WT (shEB1 + EB1WT), or FLAG-EB1N46G (shEB1 + EB1N46G). (lower) LPD and IB analysis of indicated cells from (upper). Shown are representative images from 3 biologically independent experiments. (f) Total itIC counts and (g) indicated immune subpopulations in the shNT or shEB1 knockdown/EB1WT- or EB1N46G-reconstituted SW1 tumors of the Ctl- or LF-supplemented C3H/HeN mice. n = 4 mice per group. (h) % of total CD45−/CD90−/EpCAM− tumor cells exhibiting positive pan MHC-I (left) or pan MHC-II (lower) staining from either anti-PD1 naïve patients (black squares; n = 7) or patients who failed anti-PD1 (grey squares; n = 13). All error bars represent standard error of the mean.

