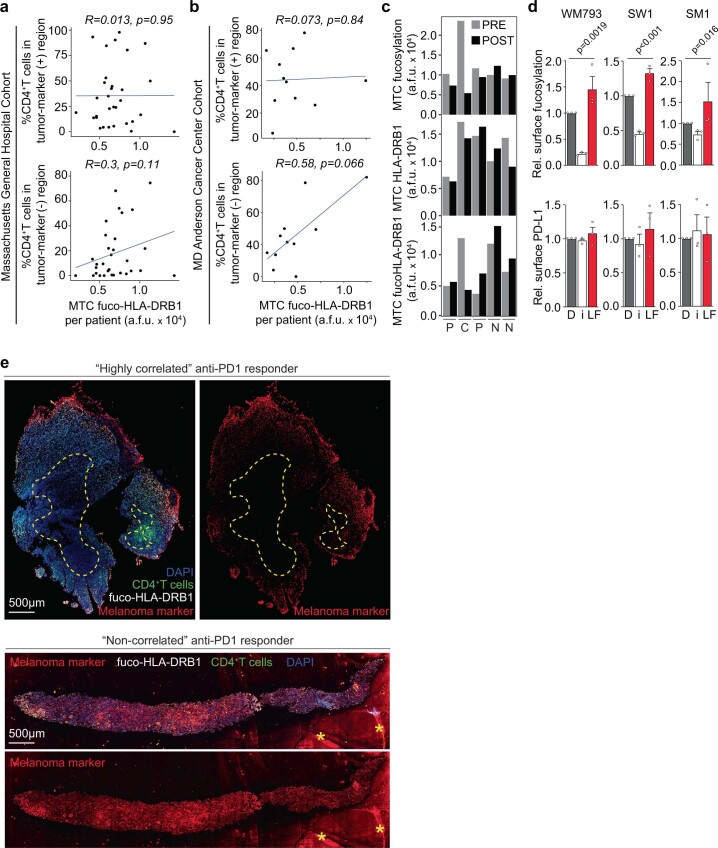
Extended Data Fig. 6. Spatial and pre-/post-anti-PD1 trends in fucosylation, total-/fuco-HLA-DRB1 & CD4+T cells in patient specimens, lack of effect of fucosylation on cell surface presence of melanoma PD-L1, & examples of stromal content discrepancy among patient biopsies.
(a) WM793 (left), SW1 (middle), and SM1 (right) cells were treated with DMSO (D) or 250 µM FUTi (i) or L-fuc (LF) and subjected to flow cytometric assessment of changes in cell surface levels of fucosylation (upper) and PD-L1 (lower). n = 3 biologically independent experiments. All error bars represent standard error of the mean. Association of mean tumor cellular (MTC) fucosylated HLA-DRB1 with % CD4+T cells either inside (tumor marker (+); upper) or outside (tumor border/periphery; tumor marker (-); lower) melanoma tumors in patients from (b) Massachusetts General Hospital or (c) MD Anderson Cancer Center (MDACC). (d) A ‘Highly correlated’ anti-PD1 responder biopsy with high fuco-HLA-DRB1 and CD4+T cell (upper) vs. a ‘non-correlated’ responder biopsy with low fuco-HLA-DRB1 and CD4+T cells were stained for indicated markers. Yellow dashed lines represent the tumor:stromal interface surrounding melanoma marker-negative stroma in the highly correlated responder that is absent in the non-correlated responder. Yellow asterisks indicate non-nucleated non-specific staining on the non-correlated responder slide. (e) Mean tumor cellular (MTC) total fucosylation (upper), total HLA-DRB1 (middle), or fucosylated HLA-DRB1 (lower) levels in MDACC patient-matched pre-/post-anti-PD1 tumor specimens. C/P/N = Complete/partial/non-responder, respectively. P-values shown are two-sided P-values derived from the Spearman correlation test.

