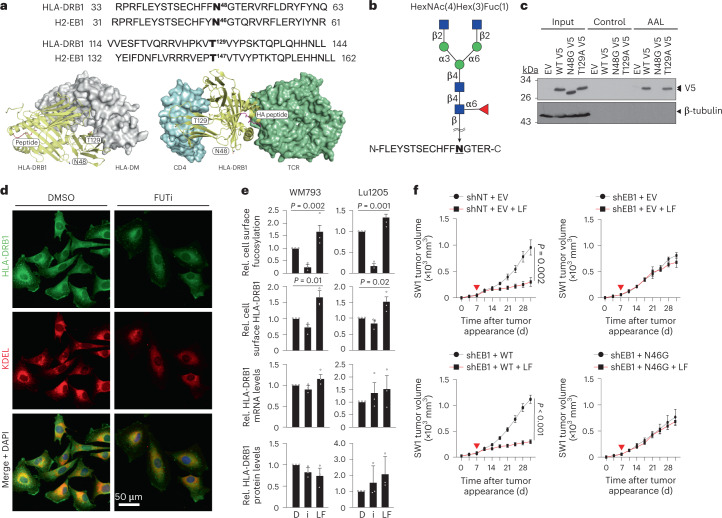
Fig. 4. N-linked fucosylation of HLA-DRB1 at N48 regulates its cell surface localization and is required for tumor suppression and increased itIC abundance.
a, Top, amino acid sequence alignments showing conservation of predicted N- and O-linked fucosylation sites in human HLA-DRB1 (N48 and T129) and mouse H2EB1 (N46 and T147). Structural modeling of the HLA-DRB1–HLA-DM (bottom left) and CD4–HLA-DRB1–TCR (bottom right) complexes. Potential glycosylation sites, N48 and T129, of the HLA-DR1 β-chain are shown as sticks. CD4 (cyan), HLA-DRB1 (yellow), antigen peptide (magenta) and TCR (green) (bottom right). b, The HLA-DRB1 peptide fragment was identified by nano-LC–MS to be fucosylated on N48, with the predicted HexNAc(4)Hex(3)Fuc(1) glycan structure shown above. c, LPD and IB analyses of EV and V5-tagged WT HLA-DRB1 (WT)-, HLA-DRB1N48G (N48G)- and HLA-DRB1T129A (T129A)-expressing WM793 cells. d, DMSO- or FUTi-treated WM793 cells immunofluorescently stained for endogenous HLA-DRB1 (green), KDEL (ER marker; red) and 4,6-diamidino-2-phenylindole (DAPI) (blue) (×20 magnification). e, Flow cytometric analysis for relative (rel.) cell surface fucosylation (top) and cell surface HLA-DRB1 (top middle), quantitative PCR with reverse transcription (RT–qPCR) analysis of relative HLA-DRB1 mRNA levels (bottom middle) and IB analysis of HLA-DRB1 protein levels (bottom) in WM793 and 1205Lu cells treated with DMSO (D), 250 µM FUTi (i) or 250 µM l-fuc. n = 3 biologically independent experiments. f, Volumetric growth curves for shNT and EV (control SW1 tumors) (top left) or shEB1 tumors reconstituted with EV (top right), EB1WT (bottom left) or EB1N46G (bottom right) in C3H/HeN mice. Control (gray) or l-fuc-supplemented water (red, 100 mM; red triangle, initiated supplementation) was provided ad libitum. Tumor growth curves show mean ± s.e.m. per mouse group. n = 7 mice per group except the shEB1 and EV group, which had six mice. For c,d, representative images are shown for n = 3 independent biological replicate experiments.

