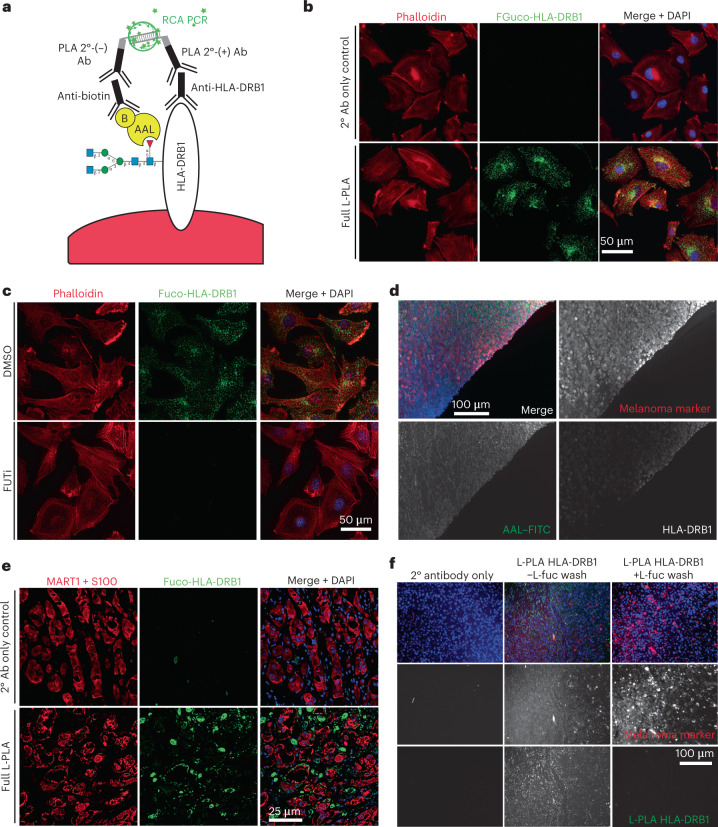
Fig. 6. Immunofluorescent visualization of fucosylated HLA-DRB1: development of the lectin-mediated proximity ligation technique.
a, Schematic of L-PLA using fucosylated HLA-DRB1 (fuco-HLA-DRB1) as an example. We stained for (1) HLA-DRB1 using anti-HLA-DRB1 antibody followed by oligonucleotide-conjugated PLA secondary antibody (2° Ab) (+) and (2) fucosylated glycan using biotinylated (‘B’) AAL lectin followed by anti-biotin antibody followed by oligonucleotide-conjugated PLA secondary (−). Ligated PLA oligonucleotides were subjected to rolling circle amplification PCR (RCA PCR), giving rise to fluorescent punctae. b, Representative images of secondary antibody-only control (top) or full L-PLA (bottom) staining of endogenous, fucosylated HLA-DRB1 (green) performed on coverslip-grown WM793 cells (with phalloidin (red) and DAPI (blue) co-stains). c, To further demonstrate that fucosylated HLA-DRB1 L-PLA staining is fucosylation species-specific, we performed L-PLA of endogenous, fucosylated HLA-DRB1 (green) on WM793 cells treated with DMSO or FUTi (phalloidin (red) and DAPI (blue) co-stains). d, To demonstrate specificity of individual L-PLA primary antibodies, FFPE melanoma tissue was stained for a melanoma marker (MART1 and S100 cocktail; red), AAL–FITC (green), HLA-DRB1 (white) and DAPI (blue). e, Representative images of secondary antibody-only control (top) or full L-PLA (bottom) staining of endogenous, fucosylated HLA-DRB1 (green) performed on human melanoma specimens (with MART1 and S100 (red) and DAPI (blue) co-stains). f, FFPE melanoma tissues were subjected to L-PLA HLA-DRB1 staining with or without washing with 500 mM l-fuc and subsequent staining with MART1 and S100 (red) and DAPI (blue). Total loss of fucosylated HLA-DRB1 (green) signal in tissue washed with l-fuc confirms the fucose-specificity of L-PLA for fucosylated HLA-DRB1. Single melanoma marker and fucosylated HLA-DRB1 channels are shown in white for clear visualization. For b–f, representative images are shown for n = 3 independent biological replicate experiments.

