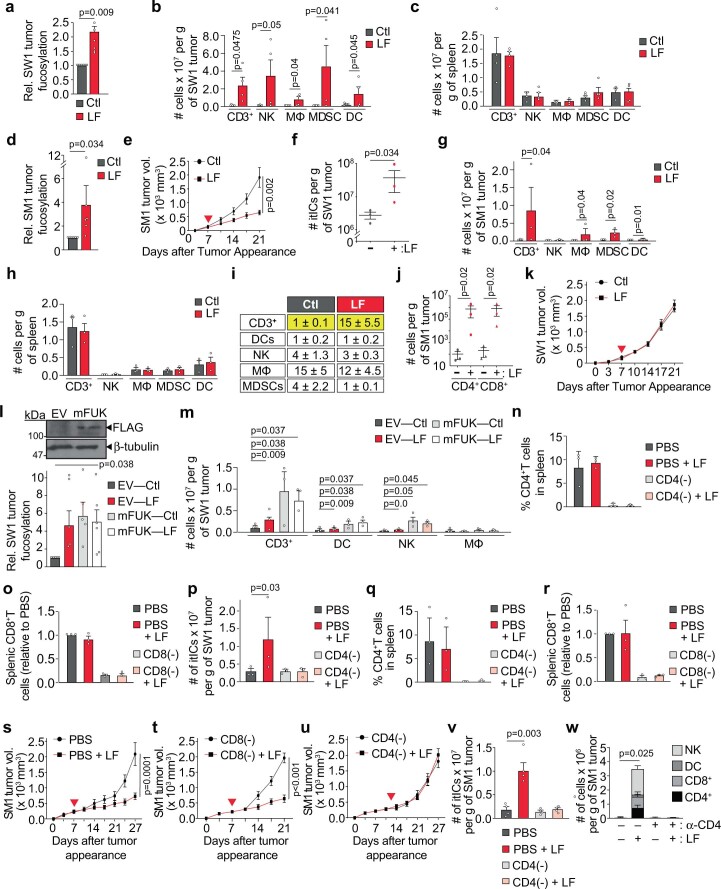
Extended Data Fig. 1. Confirming increased tumor fucosylation and itIC counts, splenic immune cell profiles, and correlations between tumor fucosylation and CD3+T cells in female vs. male melanoma patients.
Immunofluorescent (IF) staining analysis of SW1 tumor FFPE sections for intratumoral fucosylation (a) (n = 2 representative fields from 3 mice per group). Flow cytometric profiling of intratumoral immune cell (itIC) subpopulations (CD3+T cells, natural killer cells (NKs), macrophages (MΦ), MDSC-like cells (MDSCs), and dendritic cells (DCs)) in (b) SW1 tumors (n = 4 mice per group) and (c) spleens (n = 3 mice per group) in control (Ctl)- or L-fuc (LF)-supplemented SW1 tumor-bearing C3H/HeN mice from Fig. 1a. IF staining analysis of SM1 tumor FFPE sections for intratumoral fucosylation (d) (n = 2 representative fields from 3 mice per group). (e) Volumetric growth curves (n = 7 and 8 mice for Ctl and LF groups, respectively), (f) total itIC counts, (g) absolute itIC subpopulations, (h) splenic immune cell profiles, (i) % itIC subpopulations, (j) intratumoral CD4+ and CD8+T cell counts of SM1 tumors in C57BL6 mice (for (f-j), n = 3 mice per group). (k) Volumetric growth curves of SW1 tumors in NSG mice (n = 10 mice per group). (l) IB analysis confirming mFUK expression in SW1 cells (upper), IF staining analysis of SW1 tumor FFPE sections for intratumoral fucosylation (lower) (n = 2 representative fields from 3 mice per group), and (m) flow cytometric profiling of indicated immune populations in EV- or mFUK-expressing SW1 tumors from Ctl- or LF-supplemented C3H/HeN mice. (n) Flow cytometric profiling of splenic CD4+T cells in control (PBS-injected) vs. CD4+T cell-depleted (CD4(-)) SW1 tumor-bearing C3H/HeN mice supplemented ± LF. (o) IF staining profiling of splenic CD8+T cells in control vs. CD8+ T cell-depleted (CD8(-)) SW1 tumor-bearing C3H/HeN mice. Flow cytometric profiling of (p) total itIC counts in control vs. CD4(-) SW1 tumor-bearing C3H/HeN mice and (q) splenic CD4+T cells in control vs. CD4(-) SM1 tumor-bearing C57BL6 mice supplemented ± LF. Percentages represent % CD4+T of total splenic cells. (r) IF profiling of splenic CD8+T cells in control vs. CD8(-) SM1 tumor-bearing C57BL6 mice fed ± L-fuc (for (m-r), n = 3 mice per group). Volumetric growth curves for SM1 tumors in (s) control (PBS)-injected, (t) CD8(-), or (u) CD4(-) C57BL6 mice (for (s-u), n = 7 mice per group, except for PBS + LF, which had 8 mice). (v) Flow cytometric profiling of total itIC counts in control (s) vs. CD4(-) (u) mice. (w) Comparison of intratumoral NK, DC, CD8+T, and CD4+T subpopulations from control or CD4(-) (α-CD4) depleted tumors in (s) and (u) (for (v and w), n = 4 mice per group). For each mouse model: when tumors reached ~150 mm3, Ctl- or LF-supplemented water (100 mM; red triangle = initiated supplementation) was provided ad libitum. The tumor growth curves are means ± SEM per group. Relative fold-changes in splenic CD8+T cells were determined by (total intrasplenic CD8+ signal area / total intrasplenic DAPI area) as a measure of relative CD8+T cell abundance/spleen. All error bars represent standard error of the mean.

