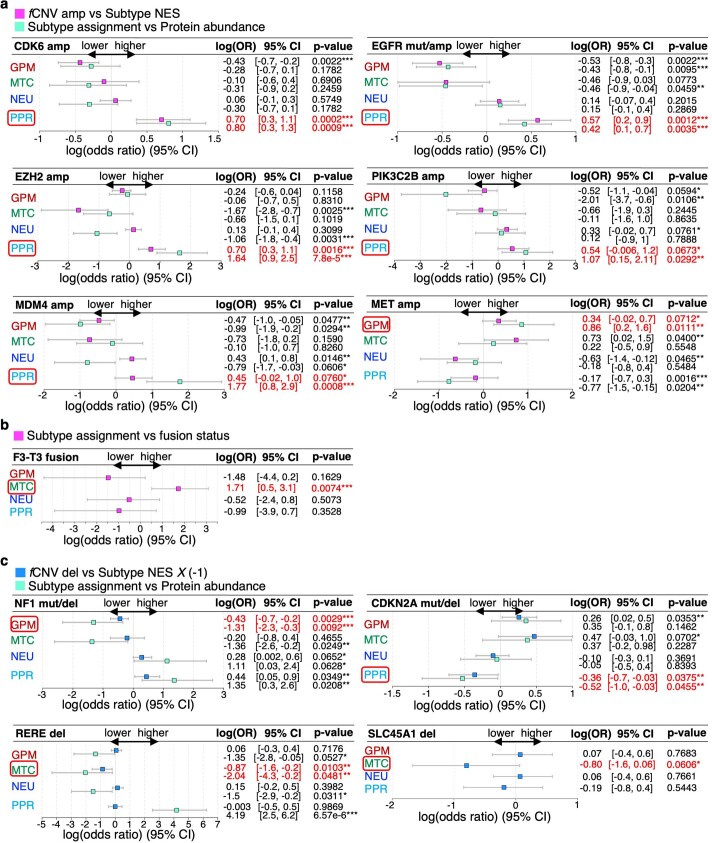
Extended Data Fig. 2. Association between fCNV status of GBM driver genes and pathway-based subtypes.
a, Forest plots showing the association between fCNV amplification/mutation status of GBM driver oncogenes and subtype transcriptomic activity (magenta) or abundance of protein of the corresponding gene (light blue) in the CPTAC-GBM cohort (n = 84 GBM samples; univariate logistic regression). log(odd ratio) estimates (OR), 95% confidence intervals (CI) and P values are reported. log(OR) estimates higher/lower than 0 represent positive/negative association. b, FGFR3-TACC3 fusion analysis was performed using a cohort of GBM profiled by FFPE tissue RNA-Seq (n = 170 GBM samples; univariate logistic regression). log(OR) estimates, 95% CI and P values are reported. c, Forest plots showing the association between fCNV deletion/mutation status in GBM tumor suppressor genes and subtype transcriptomic activity (blue) or protein abundance of the corresponding gene (light blue; n = 84 GBM samples; univariate logistic regression). log(OR) estimates, 95% CI and P values are reported. For tumor suppressor genes, subtype activity values (NES) were multiplied by −1 for visualization purposes.

