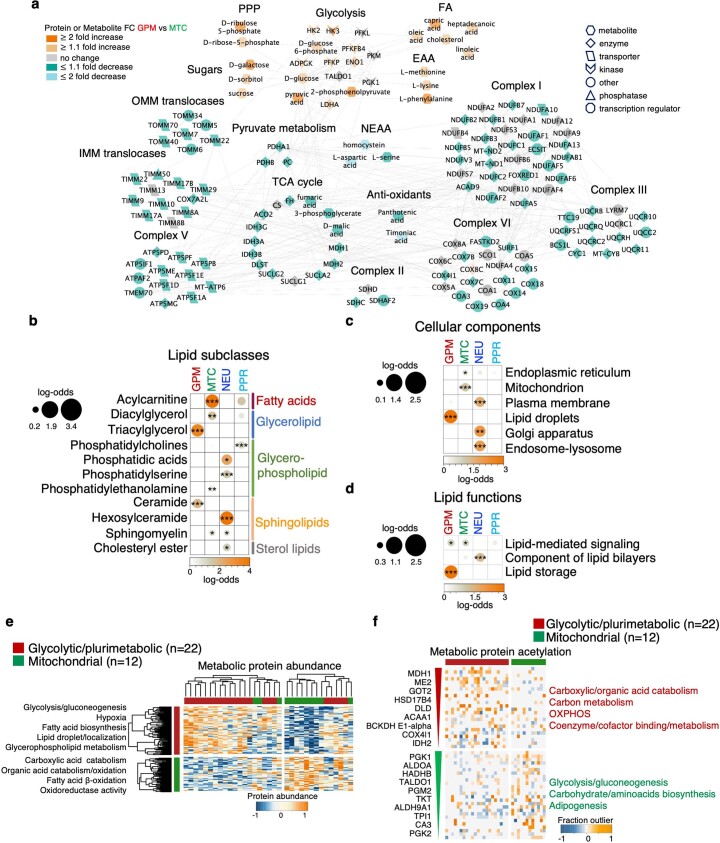
Extended Data Fig. 3. Multiplatform validation of the metabolic axis of the GBM subtypes.
a, Comparative analysis of the interactome network including intermediate metabolites and enzymes of the indicated metabolic activities in GPM versus MTC tumors (GPM GBM samples: n = 16; MTC GBM samples: n = 10 for metabolites; GPM GBM samples: n = 22; MTC GBM samples: n = 12 for proteins; two-sided MWW test). Orange to green scale indicates metabolite/protein increase to decrease in GPM versus MTC samples; [glycolytic intermediates: logit(NES) = 1.76, P = 0.0007, mitochondrial intermediates: logit(NES) = −1.65, P = 0.018; glycolytic proteins: logit(NES) = 1.27, P = 0.017, mitochondrial proteins: logit(NES) = −1.19, P = 5.93e-13; two-sided MWW-GST]. b-d, Enrichment analysis of b, lipid subclasses and c, LION terms, grouped according to cellular components and d, lipid functions. Lipid subclasses and LION terms significantly enriched in at least one GBM subtype are reported (n = 64 GBM samples; log odds ratio > 0, P < 0.05; Fisher’s exact test). Circles are color-coded and their size reflect the log odds ratio. Asterisks: * P < 0.05, ** P < 0.005, *** P < 0.001. e, Heat map showing unsupervised clustering of metabolic proteins differentially expressed between MTC and GPM samples [log2(FC) > 0.3, P < 0.05; two-sided MWW test]. Biological pathways significantly enriched in metabolic proteins are reported on the right (log odds ratio > 0, P < 0.05; Fisher’s exact test). n, number of GBM samples in GPM and MTC subtypes. f, Heat map depicting the outlier fraction of acetylated metabolic protein in GPM and MTC tumors (P < 0.05; BlackSheep). Representative outlier acetylated proteins are listed on the left according to decreasing P value. Biological pathways significantly enriched in outlier acetylated proteins are reported on the right (P < 0.0005; Fisher’s exact test). n, number of GBM samples in GPM and MTC subtypes.

