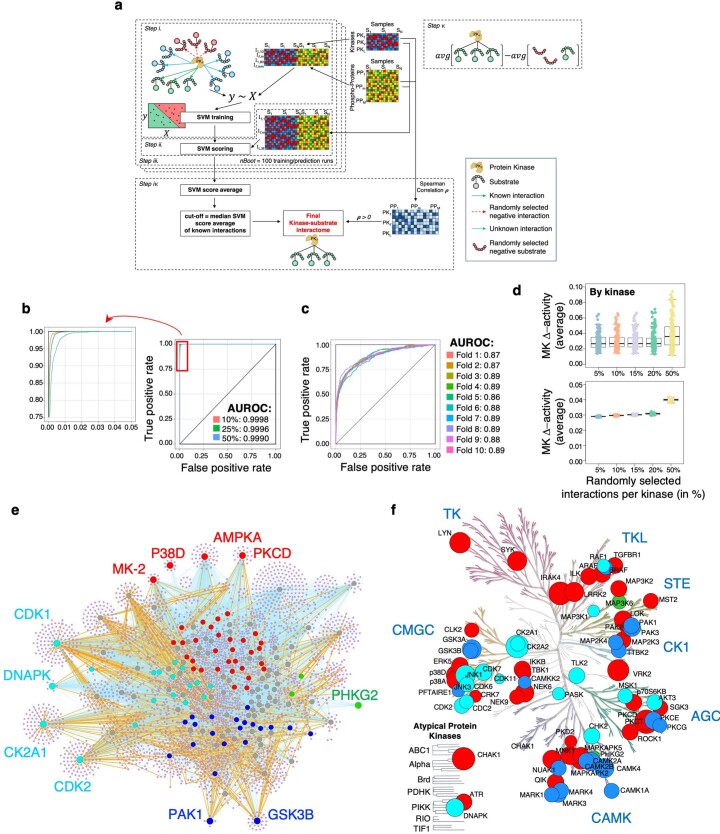
Extended Data Fig. 4. Computational strategy for the identification of MKs in functional GBM subtypes and benchmarking of SPHINKS approach.
a, The reconstruction of an unbiased kinome network combines SVM classifiers trained on different instances of the negative set as follows: (step i) train SVM classifier on validated kinase-substrate interactions (green arrows, positive training set) and a subset of randomly selected unknown interactions (red dotted arrow, negative set) using kinase abundance from proteomics and substrate abundance from phosho-proteomics; (step ii) compute a score for all the interactions in the network according to the SVM classifier; (step iii) perform bagging and obtain the average SVM scores; (step iv) retain only interactions whose average score was above the average SVM score threshold (50% of the known interactions) and whose Spearman’s correlation was positive; (step v) calculate MKs activity as the difference of two terms, the weighted average of the predicted substrate’s abundances using the SPHINKS score as weight (left), and the weighted average of randomly selected control substrate-set (right). b, ROC curves of the predictions of the interactions by SPHINKS derived from simulated phospho-proteomic matrix with different rates of missing values. The top-left side of plot was magnified for accurate visualization. c, ROC curves of the interactions by SPHINKS for each of the 10 cross-validation iterations of experimentally validated interactions. d, Box plots of the average kinase Δ-activity (percentage) from unperturbed versus 100 networks perturbed with random phosphosites interactions for each kinase replacing true interactions in the network (p = 5%, 10%, 15%, 20%, 50%). In the upper plot, each dot represents the average Δ-activity for each kinase across all runs at each perturbation percentage; in the lower plot, each dot represents the average Δ-activity for each run across all kinases at each ratio of perturbation. Box plots span the first to third quartiles and whiskers show the 1.5 × interquartile range. e, Kinase-substrate interactome from SPHINKS highlighting MKs for each functional subtype indicated by colors: red, green, blue and cyan, MKs in GPM, MTC, NEU, and PPR, respectively (effect size > 0.3, P < 0.01; two-sided MWW test; n = 85 GBM samples). Nodes represent kinases and substrates, and lines their interactions. Gray nodes are subtype non-specific kinases; purple nodes are kinase-targeted phosphosites substrates. Orange lines indicate kinase-phosphosite interactions from PhosphoSitePlus; cyan lines represent novel kinase-substrate interactions inferred by the SPHINKS. f, MKs significantly active in each functional GBM subtype were mapped onto the human kinome tree. Red, green, blue and cyan, MKs in GPM, MTC, NEU, and PPR, respectively. The size of the circles is proportional to the kinase activity. The number of GBM samples is as in e.

