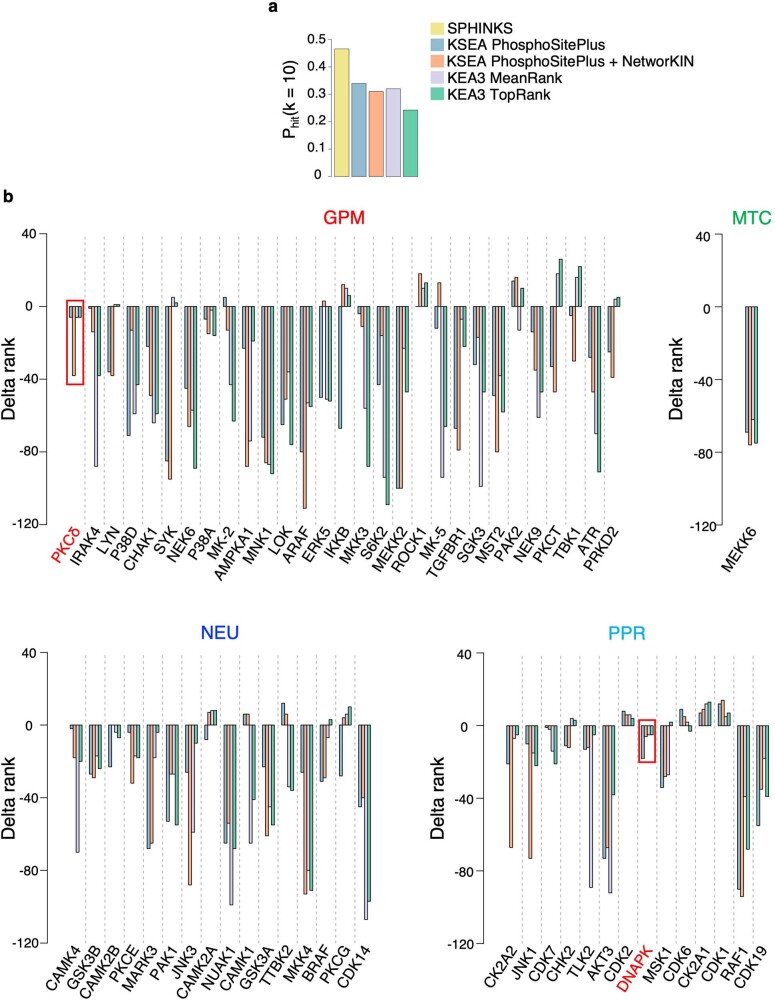
Extended Data Fig. 5. Benchmarking of SPHINKS against previously published kinase-substrate inference methods.
a, Bar plot showing the probability of correctly identifying upregulated or downregulated kinases by the analysis of the ‘top-10-hit’ using the indicated inference methods (n = 103 kinase perturbations). b, Bar plot of the differential rank (Δ-rank) of activity between SPHINKS and the indicated inference methods for the kinases significantly active in each GBM subtype by SPHINKS and common to the networks of all five approaches (n = 85 GBM samples). Kinases are ordered according to the rank of activity by SPHINKS.

