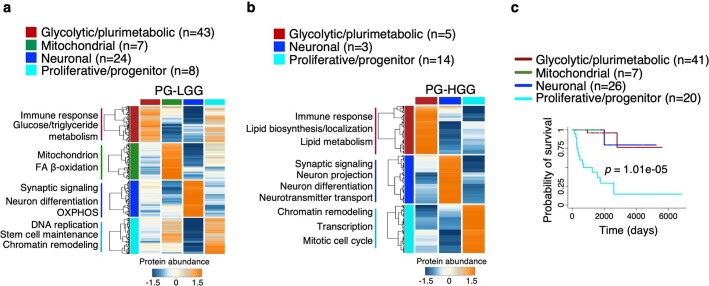
Extended Data Fig. 7. Proteomics characterization and clinical outcome of PG stratified according to functional subtypes.
a-b, Heat map showing the median abundance of the 150 highest scoring proteins of the ranked lists (two-sided MWW test) of the four functional subtypes in a, PG-LGG and b, PG-HGG (two-sided MWW test). Rows are proteins and columns are functional subtypes (n = 82 PG-LGG samples; n = 22 PG-HGG samples). Left and top color tracks indicate functional subtypes. Unsupervised clustering was performed for each subtype-specific protein signature. For each subtype, biological pathways significantly enriched by each gene subcluster are reported on the left (P < 0.05, Fisher’s exact test). c, Kaplan–Meier curves of PG (n = 94 patients) stratified by SNF combining gene and protein signatures obtained from the functional GBM subtypes. Patients in the PPR subgroup exhibit significantly worse survival (log-rank test).

