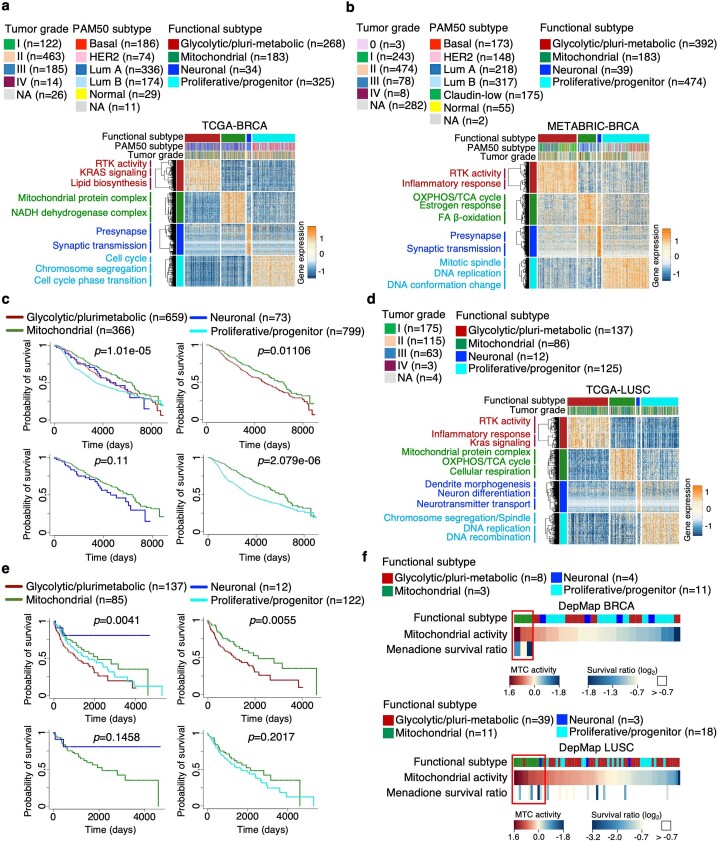
Extended Data Fig. 8. Functional classification of BRCA and LSCC and prognostic implications.
a-b, Heat map showing the 150 highest scoring genes of the ranked lists of the four functional subtypes obtained from tumors classified in a, TCGA- (n = 810 BRCA samples) and b, METABRIC-BRCA (n = 1,088 BRCA samples) datasets (two-sided MWW test). Rows are genes and columns are tumors. Horizontal top and left tracks indicate functional subtypes; horizontal middle track indicates PAM50 classification of BRCA by TCGA; horizontal lower track indicates tumor grade. Unsupervised clustering was performed for each subtype-specific gene signature. Biological pathways significantly enriched by each gene subcluster are reported on the left (P < 0.05; Fisher’s exact test). c, Kaplan–Meier curves and log-rank test analysis of 1,897 BRCA patients from the combined TCGA (n = 809 patients) and METABRIC datasets (n = 1,088 patients), stratified according to the four functional subclasses (log-rank test). d, Heat map showing the 150 highest scoring genes of the ranked lists of the four functional subtypes in LUSC from TCGA database (n = 360 LUSC samples; two-sided MWW test). Rows are genes and columns are tumors. Horizontal top and left tracks indicate functional subtypes; horizontal lower track indicates tumor grade. Unsupervised clustering was performed for each subtype-specific gene signature. For each subtype, biological pathways significantly enriched by each gene subcluster are reported on the left (P < 0.05; Fisher’s exact test). e, Kaplan–Meier curves of 356 patients with LUSC from the TCGA dataset stratified according to the four functional subclasses. f, Mitochondrial activity (NES) and menadione survival ratio (log2) for 26 BRCA (upper plot) and 71 LUSC (lower plot) cell lines from DepMap. Upper track, functional classification; middle track, mitochondrial activity; lower track, menadione survival ratio. Survival ratio: difference between mitochondrial cell lines versus the others; log2(FC) = −1.31, p = 0.008 for BRCA; log2(FC) = −0.63, p = 0.076 for LUSC; two-sided t-test, unequal variance.

