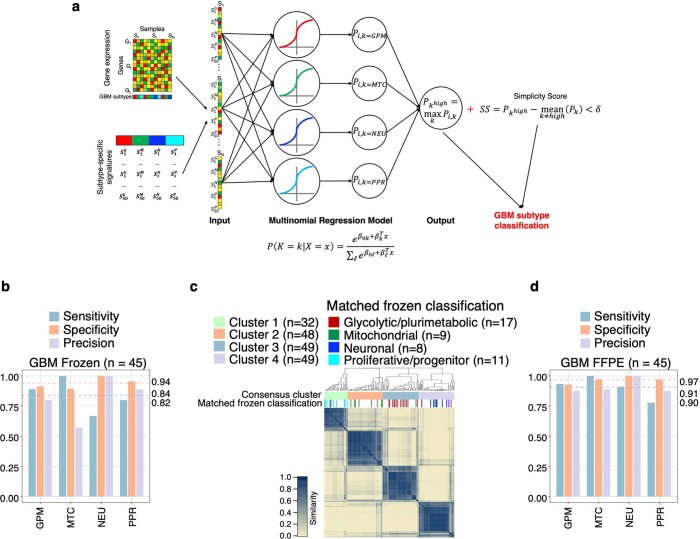
Extended Data Fig. 10. Clinical-grade probabilistic tool for the classification of frozen and FFPE IDH wild-type GBM.
a, Schematics of the approach for calculating the probability of a GBM sample of belonging to one of the four defined functional subtypes. The Agilent expression data of 506 samples from the TCGA cohort of GBM were classified into one of the four functional subtypes (top left). The standardized expression of all the genes from the subtype-specific gene signatures (bottom left) was used to train a multinomial regression model with lasso penalty using glmnet (middle part). Each sample (input) was used to build a multi-class logistic regression model that returns four probabilities Pi,k, one for each functional GBM subtype. We classified a tumor into one subtype if the fitted probability of the particular subtype was the highest () and the sample showed a simplicity score (SS) above a defined threshold (δ). Tumors that did not comply with the defined thresholds remained unclassified. b, Comparison bar plot of sensitivity, specificity, and precision in each GBM subtype of the multinomial regression model using RNA-Seq data from 45 matched frozen samples. c, Consensus clustering generated from the 178 FFPE GBM samples using the expression of the 200 genes from the FFPE-specific gene signatures. Columns and rows represent FFPE samples. Color bar on the top defines four subgroups according consensus clustering. Track at bottom indicates the functional classification of the corresponding 45 matched frozen samples. The number (n) of samples in each cluster and subtype is indicated. Yellow-to-blue scale indicates low to high similarity. d, Comparison bar plot of sensitivity, specificity, and precision in each GBM subtype of the multinomial regression model using RNA-Seq data from 45 matched FFPE samples. Dashed lines and corresponding values indicate the average of each performance measure (blue: sensitivity; orange: specificity; purple: precision) in each GBM subgroup.

