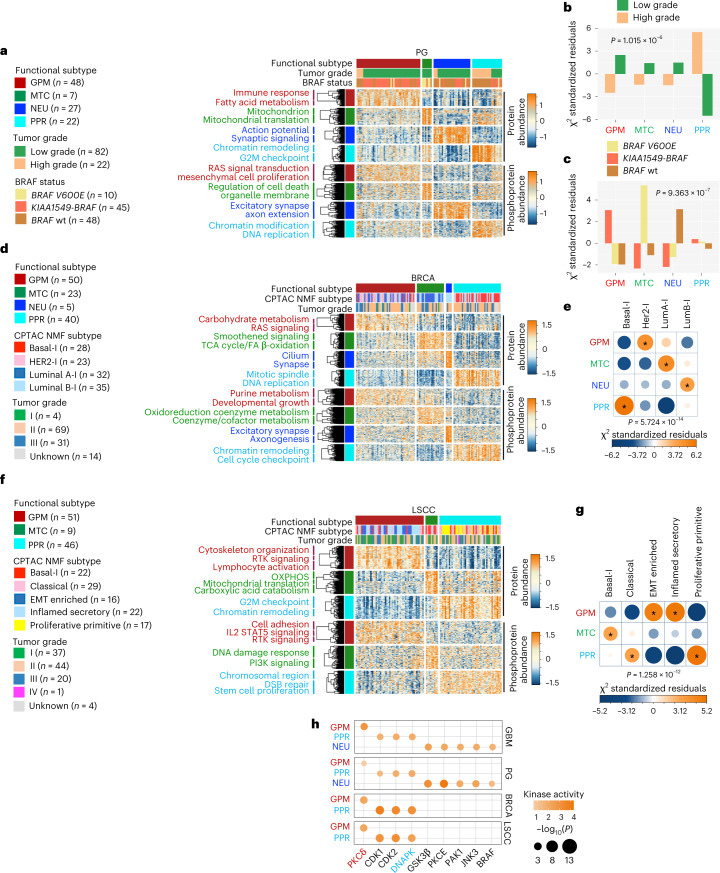
Fig. 7. Functional activities of GBM subgroups classify different cancer types and inform survival and master kinases.
a, Heat map showing the 150 highest scoring proteins (top) and phosphosites (bottom) of four functional subtypes of CPTAC-PG; rows show proteins/phosphosites and columns show tumors (n = 104 PG samples; two-sided MWW test). Left and top tracks indicate the functional subtypes; middle track indicates tumor grade; and bottom track indicates BRAF status. Unsupervised clustering of protein/phosphosite signatures and pathways significantly enriched are reported on the left (P < 0.05; Fisher’s exact test). b, Association of tumor grade with functional PG subtypes. Bars indicate standardized residuals (chi-squared test). The number (n) of PG samples is as in a. c, Association of BRAF status with functional subtypes of PG-LGG (n = 82 PG-LGG samples). Bars indicate standardized residuals (chi-squared test). d, Heat map showing the 150 highest scoring proteins (top) and phosphosites (bottom) of functional subtypes in CPTAC-BRCA (two-sided MWW test). Rows are proteins/phosphosites and columns are tumors (n = 118 BRCA samples). Left and top tracks indicate functional subtypes; middle track indicates NMF multi-omics classification of CPTAC-BRCA (I, inclusive); and bottom track indicates tumor grade. Unsupervised clustering of protein/phosphosites signatures and pathways significantly enriched are reported on the left (P < 0.05; Fisher’s exact test). e, Association of NMF-based BRCA with functional subtypes. Circles are color coded and their size reflects the standardized residuals (chi-squared test). Orange-to-blue scale indicates positive to negative enrichment. The number (n) of BRCA samples is as in d. f, Heat map showing the 150 highest scoring proteins (top) and phosphosites (bottom) of functional subtypes in CPTAC-LSCC (two-sided MWW test). Rows are proteins/phosphosites and columns are tumors (n = 106 LSCC samples). Left and top tracks indicate functional subtypes; middle track indicates the NMF multi-omics classification of CPTAC-LSCC; bottom track indicates tumor grade. Unsupervised clustering of protein/phosphosites signature and pathways significantly enriched are reported on the left (P < 0.05; Fisher’s exact test). g, Association of NMF-based LSCC with functional subtypes. Circles are color coded and their size reflects the standardized residuals (chi-squared test). Orange-to-blue scale indicates positive to negative enrichment. The number (n) of LSCC samples is as in f. h, Grid plot showing top-scoring MKs common to each functional GBM, PG, BRCA and LSCC subtype (GBM, n = 85 samples; PG, n = 104 samples; BRCA, n = 118 samples; LSCC, n = 106 samples). Dots are colored according to kinase activity and their size reflect the significance of the differential activity in each group (effect size > 0.3 and P < 0.01; two-sided MWW test). All asterisks in e,g indicate standardized residuals higher than 1.5.

