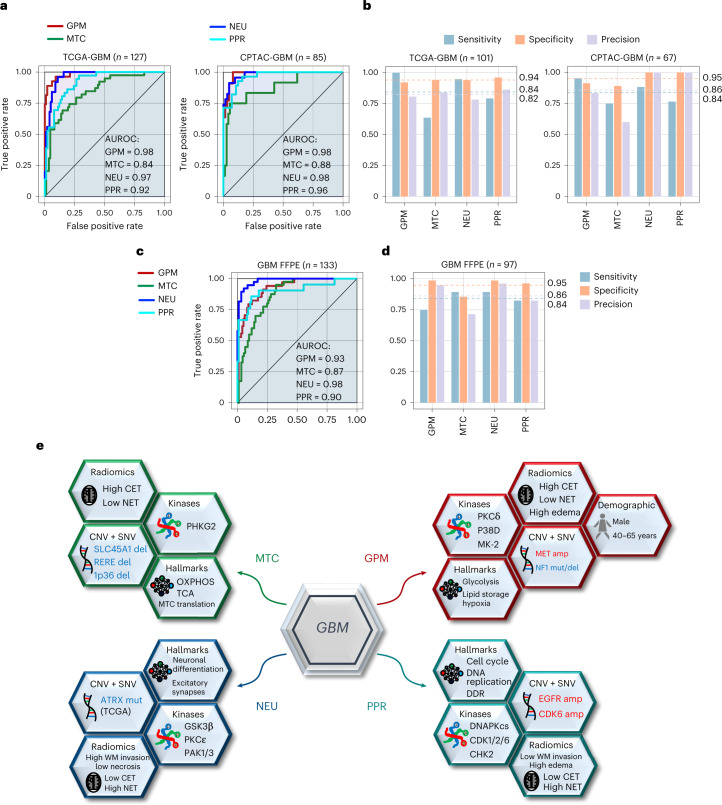
Fig. 8. Probabilistic classifier for the identification of functional tumor subtypes of IDH wild-type GBM and schematic multi-omics and clinical modules of functional subtypes of GBM.
a, GBM subtype-specific ROC curves for the multinomial regression model using RNA-seq data from frozen samples. Validation includes RNA-seq data from TCGA (left) or CPTAC (right) GBM samples. The number (n) of GBM samples for each dataset is indicated. b, Comparison bar plot of sensitivity, specificity and precision in each GBM subtype of the multinomial regression model as in a. Dashed lines and corresponding values indicate the average of each performance measure (blue, sensitivity; orange, specificity; purple, precision) in each GBM subgroup. The number (n) of GBM samples for each dataset is indicated. c, GBM subtype-specific ROC curves for the multinomial regression model using RNA-seq data from FFPE samples. Validation includes RNA-seq obtained from FFPE tumor samples. The number of GBM samples for each dataset (n) is indicated. d, Comparison bar plot of sensitivity, specificity and precision in each GBM subtype of the multinomial regression model as in c. Dashed lines and corresponding values indicate the average of each performance measure (blue, sensitivity; orange, specificity; purple, precision) in each GBM subgroup. The number (n) of GBM samples for each dataset is indicated. e, Functional activities, genetic alterations, MKs, clinical characteristics, radiomic features and therapeutic vulnerability compose modules that distinguish each functional subtype. GBM driver genes in each module recapitulate the functional hallmark of each subtype (for example, CDK6 amplification/CDKN2A deletion for the PPR proliferation/stemness features; MET amplification/NF1 deletion for glycolysis/RAS pathway activation in GPM GBM; FGFR3-TACC3 fusion for mitochondrial activation in MTC tumors). GPM is the only subtype that significantly associates with a specific sex (male) and age group (45–65 years). GPM and MTC subtypes exhibit positive correlation with frontal/parietal and temporal tumor location, respectively. GPM, PPR and NEU are linked with radiologic features that are compatible with the biological traits of these subgroups (CET, NET and DWM invasion, respectively). In agreement with the enhanced OXPHOS and MK activity of PKCδ and DNA-PKcs in MTC, GPM and PPR, respectively, these subtypes are distinctly sensitive to mitochondrial, PKCδ and DNA-PKcs inhibitors. CET, contrast-enhancing tumor; NET, non-contrast-enhancing tumor; DWM, deep white matter).

