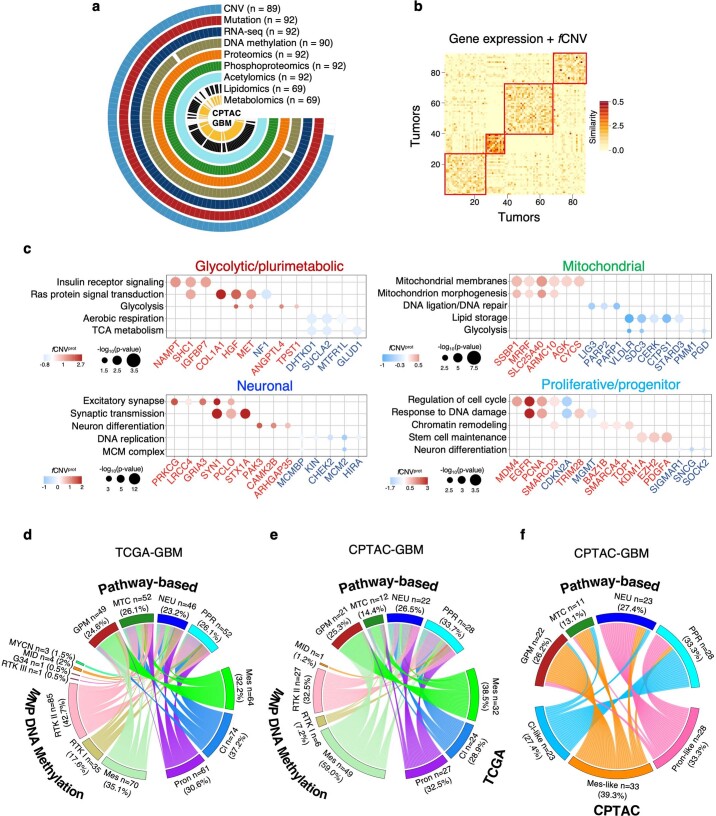
Extended Data Fig. 1. Definition of functional subtypes of GBM by SNF and relationship to prior GBM classifiers.
a, Circular plot indicating the annotation of data available for each platform and individual tumors of CPTAC-GBM cohort (n = 93 GBM samples). The number (n) of GBM samples for each platform is indicated. b, Integrative clustering of GBM tumors by SNF (n = 89 GBM samples). Heat map of patient-to-patient similarity coefficients generated by the integration of subtype-specific gene expression of the highest 50 genes in the ranked lists of the functional subtypes of 52 GBM samples classified as anchors and fCNVs associated with the four GBM subtypes from TCGA. Yellow-to-orange scale represents low to high similarity coefficient. c, Dot plot showing the genes harboring fCNVprot gain or loss and relative pathway enrichment for each GBM subtype (n = 85 GBM samples). Dot size indicates significance of the pathway enrichment (P < 0.05, Fisher’s exact test) and color the log2(FC) of the protein abundance in tumors harboring the fCNVprot alteration compared to wild-type tumors (blue to red scale indicate fCNVprot gain, red scale; fCNVprot loss, blue scale; two-sided MWW test). d-e, Chord diagram of GBM subtype assignment of the indicated classifiers in each individual tumor from TCGA (n = 199 GBM samples) (d) and CPTAC (n = 83 GBM samples) (e) datasets. f, Chord diagram of GBM subtype assignment according to the indicated classifiers in each individual tumor from the CPTAC dataset (n = 85 GBM samples).

