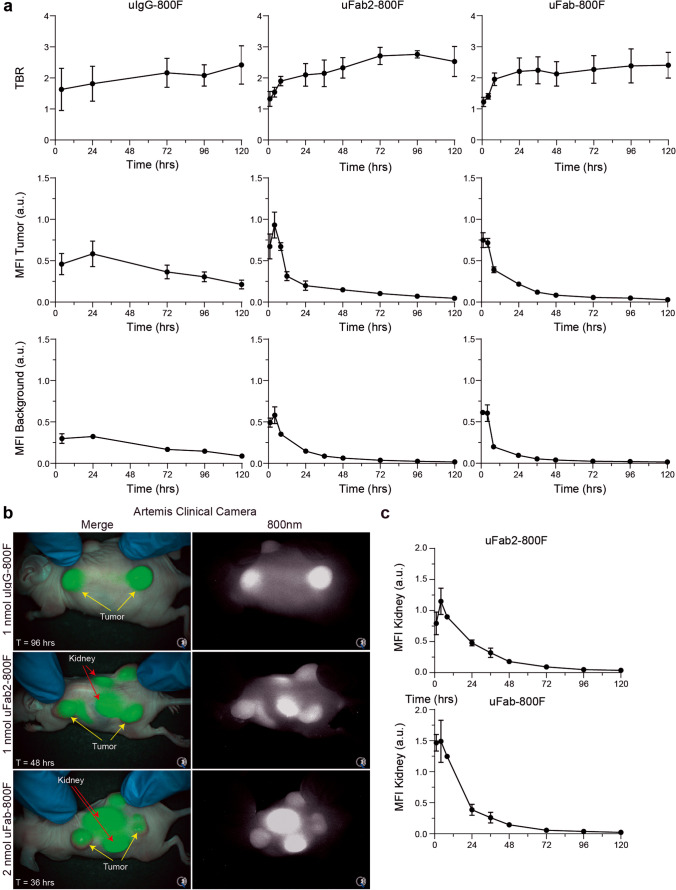
Fig. 2.
In vivo serial imaging of uIgG-800F, uFab2-800F, and uFab-800F in subcutaneous HT-29 tumor bearing mice: a TBR and MFI measured using the Pearl over time after injection of 1-nmol uIgG-800F, 1-nmol uFab2-800F, and 2-nmol uFab-800F. b Merge and 800-nm images taken with the Artemis clinical camera demonstrating real-time tumor imaging at 96 h for uIgG-800F, 48 h for uFab2-800F, and 36 h for uFab-800F. These time slots are shown as they fall within the optimal imaging window for each of the tracers. For images at other time periods, see Suppl. Figure 2 (ESM). Tumor and kidney fluorescence are identified with yellow and red arrows, respectively. c Transcutaneous kidney fluorescence over time after uFab2-800F and uFab-800F administration. a.u., arbitrary units; hrs, hours; MFI, mean fluorescence intensity; TBR, tumor-to-background ratio; T, time.

