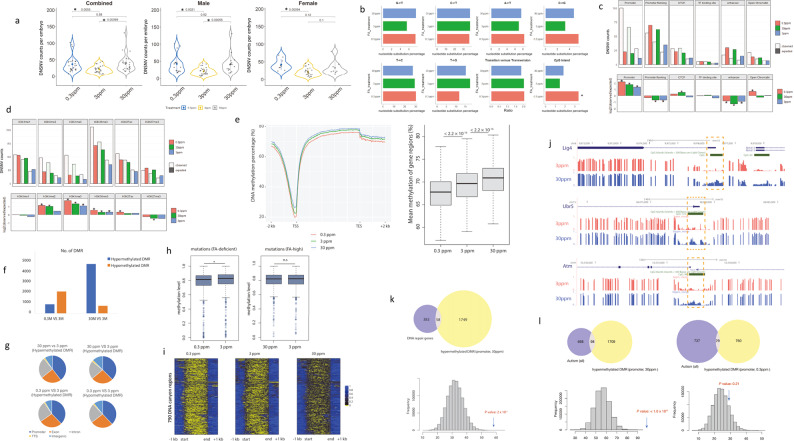
Fig. 1. Both high FA and low FA intake increases de novo mutation rate and disrupt genome DNA methylation in the offspring.
a Violin Plot of DNSNV/DNM (de novo mutation) counts among the three different FA dietary groups (sample size for each group was as follows; combined panel: 0.3 ppm group n = 26; 3 ppm group n = 26; 30 ppm group n = 25. Male panel: 0.3 ppm group n = 17; 3 ppm group n = 26; 30 ppm group n = 17. Female panel: 0.3 ppm group n = 9; 3 ppm group n = 26; 30 ppm group n = 8). Mann-Whitney U test was performed to test the differences among different groups. b Nucleotide substitution, Ts/Tv transition versus transversion ratio and CpG island DNM enrichment. Asterisks indicate significant enrichments (P < 0.05, one-sided binomial test). c DNSNV counts and enrichment analysis of promoter, promoter flanking, CTCF, TF binding site, enhancer, and open chromatin DNA region. Plots showed log2 ratio of the number of observed and expected DNSNVs indicates the effect size of the enrichment or depletion in each region. Asterisks indicate significant enrichments or depletion (*P < 0.05, one-sided binomial test). d DNSNV counts and enrichment analysis in histone methylation genomic DNA recognition regions, including H3K4me1, H3K4me2, H3K4me3, H3K36me3, H3K27ac and H3K27me3. Asterisks indicate significant enrichments or depletion (P < 0.05, one-sided binomial test). e Metagene plot showing the methylation level (percent methylated) of 2 kb upstream, TSS (Transcription Start Site), gene body, TES (Transcription End Site) 2-kb downstream region of all RefSeq annotated genes. The red, green, and blue lines represent FA-deficient, FA-control and FA-high groups, respectively. The mean methylation level of the gene regions for FA-deficient, normal, and FA-high group are shown by boxplot. The horizontal line of the box refers to the 25th percentiles, median and 75th percentiles, respectively. f Number of hypermethylated and hypomethylated DMRs identified between two FA treatment groups. g Annotation of DMR genomic location in different FA treated groups. TTS Transcription Terminate Site. h Comparison of methylation levels of 2 kb regions centered on the identified mutations (left: from FA-deficient group; right: from FA-high group) in FA-deficient and FA-control group (left) or in FA-high and FA-control group (right). i Heatmaps showing the methylation level of 790 canyons (identified from FA-control group) in FA-deficient, FA-control and FA-high. j Track figure of hypermethylation DMRs in the promoters of five DNA repair genes: Lig4, Ubr5, and Atm. k Hypermethylated DMRs in FA-high group are enriched to DNA repair genes. Permutation test was performed with the P value: 2 × 10⁻⁵. l Hypermethylated DMRs in FA-high group are enriched to autism genes. Permutation (10-6) P value is less than 1 × 10⁻⁶. Autism gene list is downloaded from SAFRI database (Simons Foundation Autism Research Initiative, 11-13-2019-updated-version, total counts = 832). Fisher’s Exact test P-value = 6.9 × 10⁻⁸. *P-value is represented on each plot. *P < 0.05, ns not significant.

